
The latest JustTrace version (Q1 2014) has some neat features. It is now possible to profile unmanaged applications with JustTrace. In this post I am going to show you how easy it is to profile native applications with JustTrace.
For the sake of simplicity I am going to profile notepad.exe editor as it is available on every Windows machine. First, we need to setup the symbol path folder so that JustTrace can decode correctly the native call stacks. This folder is the place where all required *.pdb files should be.
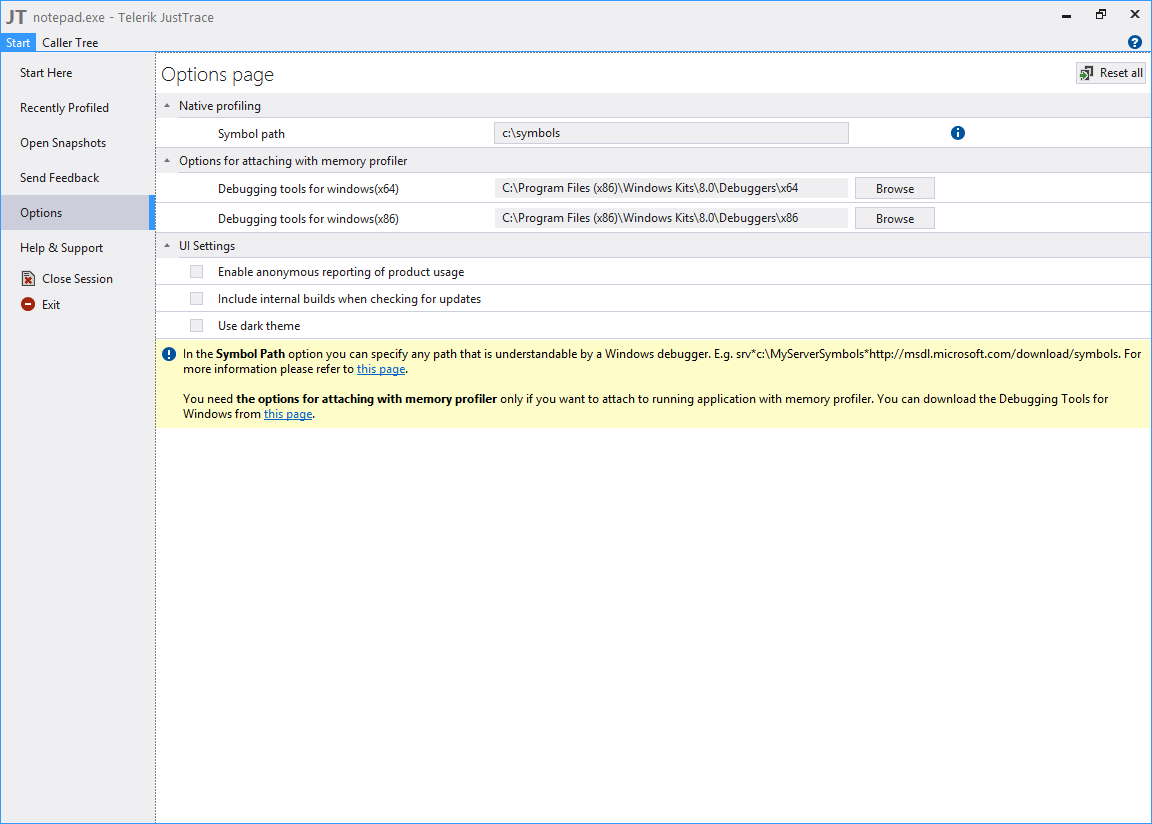
In most scenarios, we want to profile the code we wrote from within Visual Studio. If your build generates *.pdb files then it is not required to setup the symbols folder. However, in order to analyze the call stacks collected from notepad.exe we must download the debug symbols from Microsoft Symbol Server. The easiest way to obtain the debug symbol files is to use symchk.exe which comes with Microsoft Debugging Tools for Windows. Here is how we can download notepad.pdb file.
symchk.exe c:\Windows\System32\notepad.exe /s SRV*c:\symbols*http://msdl.microsoft.com/download/symbols
[Note that in order to decode full call stacks you may need to download *.pdb files for other dynamic libraries such as user32.dll and kernelbase.dll for example. With symchk.exe you can download debug symbol files for more than one module at once. For more details you can check Using SymChk page.]
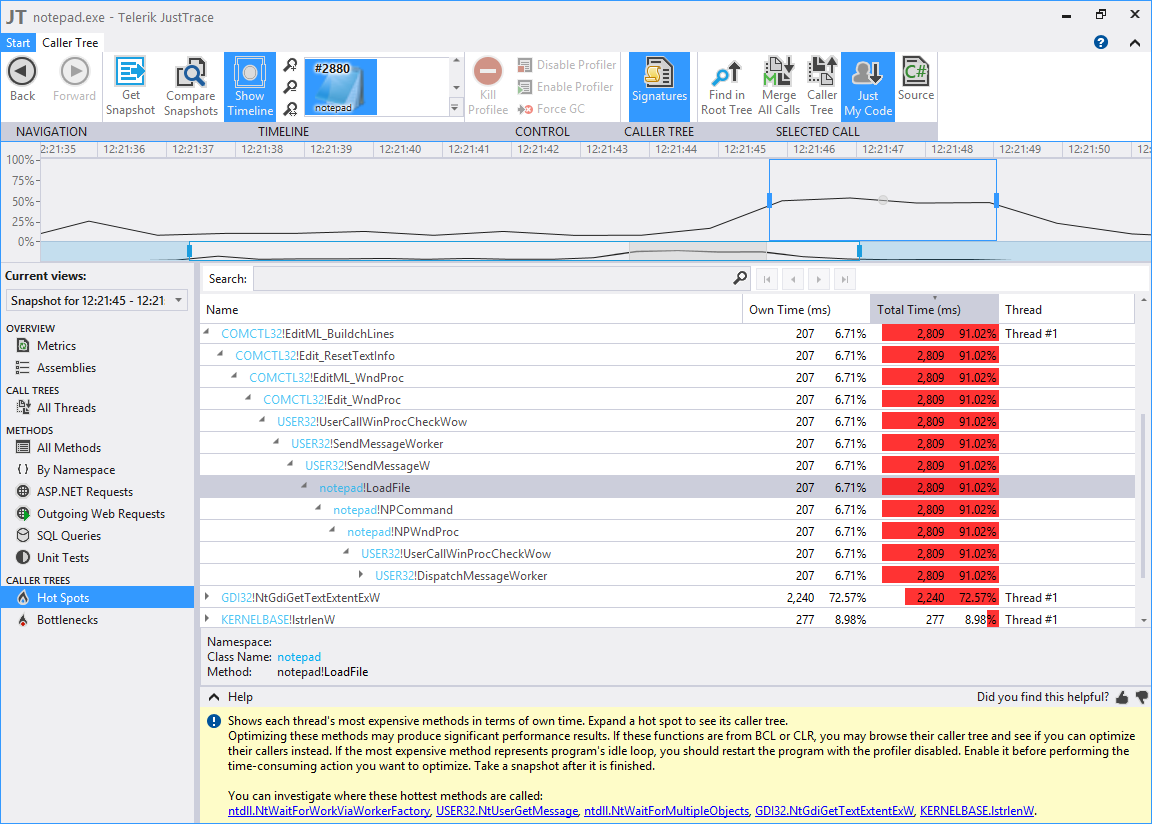
Now we are ready to profile notepad.exe editor. Navigate to New Profiling Session->Native Executable menu, enter the path to notepad.exe and click Run button. Once notepad.exe is started, open some large file and use the timeline UI control to select the time interval of interest.
In closing, I would say that JustTrace has become a versatile profiling tool which is not constrained to the .NET world anymore. There are plenty of unmanaged applications written in C or C++ and JustTrace can help to improve their performance. You should give it a try.