It is a common opinion that profiling tools are slow. Every time I stumble upon this statement I ask for the definition of slow. Most of the time I get the answer that a profiler is slow when it adds more than 100% overhead.
At present there many commercial profilers that are fast (according to the definition above). So, why don’t people use profiling tools then?
I think the confusion comes from the fact that there are different profiler types and some of them are fast while others are slow. Lets see what these profiler types are. It is common to classify profiling tools into two major categories:
- memory profilers
- performance profilers
Memory profilers are used when one wants to solve memory related issues like memory leaks, high memory consumption and so on. Performance profilers are used when one wants to solve performance related issues like high CPU usage or concurrency related problems. These categories are not set in stone though. For example too much memory allocation/consumption can cause performance issues.
Lets see why some performance profilers are fast while others are slow. All profilers, and performance profilers in particular, can be classified in yet another two categories:
- event-based profilers (also called tracing profilers)
- statistical profilers (also called sampling profilers)
Event-based profilers collect data on events from a well-defined event set. Such event set may contain events for enter/leave function, object allocation, thrown exception and so on. Statistical profilers usually collect data/samples on regular intervals (e.g. take a sample on every 5 milliseconds).
At first, it is not obvious whether event-based/tracing profilers are faster or slower than statistical/sampling ones. So, lets first have a look the the current OOP platforms. For the sake of simplicity we will have a look at the current .NET platform.

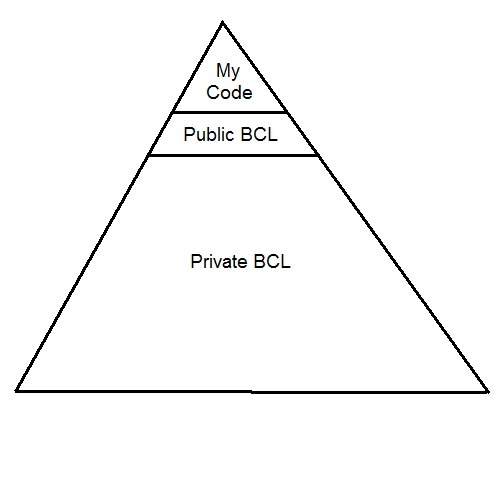
Each .NET application makes use of the .NET Base Class Library (BCL). Because of current OOP design principles most frameworks/libraries have a small set of public interfaces and a fair amount of private encapsulated APIs. Lets look at the picture above. As you see your application can call only a small number of public BCL interfaces while they in turn can call much more richer APIs. So, you see only the “tip of the iceberg”. It is a common scenario when a single call to a public BCL interface results in a few dozen private interface calls.
Lets have an application that runs for 10 seconds and examine the following two scenarios.
Scenario 1
The application makes heavy usage of “chatty” interface calls. It is easy to make 1000 method calls per second. In case of event-based/tracing performance profiler you have to process 20000 events (10000 enter function events + 10000 leave function events). In case of statistical/sampling performance profiler (assuming that the profiler collects data every 5 ms) your profiler have to process 2000 events. So, it is relatively safe to conclude that the tracing profiler will be slower than the sampling one. And this is the behavior that we most often see.
Scenario 2
Suppose your application is computation bound and performs a lot of loops and simple math operations. It is even possible that your “main” method calls a single BCL method (e.g. Console.WriteLine) only. In this case your event-based/tracing performance profiler have to process a few events only while the statistical/sampling performance profiler have to process 2000 events again. So, in this scenario is much safe to say that the tracing profiler will be faster than the sampling one.
In reality, statistical/sampling profilers have constant 2-10% overhead. Event-based/tracing profilers often have 300-1000% overhead.
Tracing or Sampling Profiler
The rule of thumb is that you should start with a sampling profiler. If you cannot solve the performance issue then you should go for a tracing profiler. Tracing profilers usually collect much more data that helps to get better understanding about the performance issue.
[Note: If you are not interested in the theoretical explanation you can skip the following two paragraphs.]
If you’ve read carefully the last sentence then you’ve seen that I’ve made the implication that the more data the profiler has collected the easier you are going to solve the performance problem. Well, that’s not entirely true. You don’t really need data. As Richard Hamming said “The purpose of computing is insight, not numbers”. So, we don’t need data but rather “insight”. How do we define “insight” then? Well, the answer comes from relatively young information management and knowledge management. We define data, information, knowledge and wisdom as follows:
- data: numbers/symbols
- information: useful data that helps to answer “who”, “what”, “where” and “when” questions; information is usually processed data
- knowledge: further processed information; it helps to answer “how” questions
- wisdom: processed and understood knowledge; it helps to answer “why” questions
So, it seems that we are looking for “information”. Here the algorithmic information theory comes to help. This theory is a mixture of Claude Shannon’s information theory and Alan Turing’s theory of computation. Andrey Kolmogorov and more recently Gregory Chaitin had defined quantitative measures of information. Though they followed different approaches an important consequence they made is that the output from any computation cannot contain more information than was the input in first place.
Conclusion
Drawing parallel back to profiling we now understand why sometimes we have to use event-based/tracing profilers. As always, everything comes at a price. Don’t be biased that profiling tools are slow. Use them and make your software better.