Every project is defined by its requirements. The requirements can be functional and non-functional. Most of the time the developers are focused on functional requirements only. This is how it is now and probably it won’t change much in the near future. We may say that the developers are obsessed by the functional requirements. In the matter of fact, a few decades earlier the software engineers thought that the future IDE will look something like this:
This is quite different from nowadays Visual Studio or Eclipse. The reason is not that it is technically impossible. On contrary, it is technically possible. This is one of the reasons for the great enthusiasm of the software engineers back then. The reason this didn’t happen is simple. People are not that good at making specifications. Today no one expects to build large software by a single, huge, monolithic specification. Instead we practice iterative processes, each time implementing a small part of the specification. The specifications evolve during the project and so on.
While we still struggle with the tools for functional requirements verification we made a big progress with the tools for non-functional requirements verification. Usually we call such tools profilers. Today we have a lot of useful profiling tools. These tools analyze the software for performance and memory issues. Using a profiler as a part from the development process can be a big cost-saver. Profilers liberate software engineers from the boring task to watch for performance issues all the time. Instead the developers can stay focused on the implementation and verification of the functional requirements.
Take for example the following code:
FileStream fs = …
using (var reader = new StreamReader(fs, ...))
{
    while (reader.BaseStream.Position < reader.BaseStream.Length)
    {
       string line = reader.ReadLine();

       // process the line
    }
}
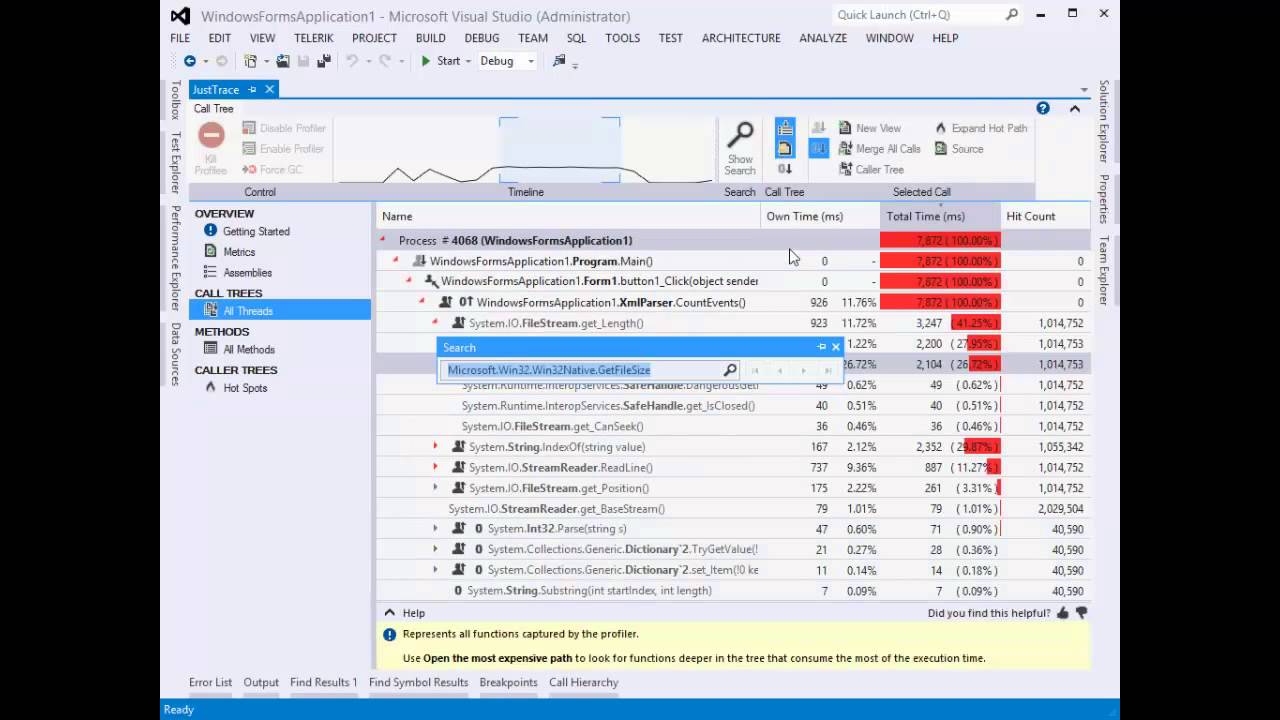
This is a straightforward and simple piece of code. It has an explicit intention – process a text file reading one line at a time. The performance issue here is that the Length property calls the native function GetFileSize(…) and this is an expensive operation. So, if you are going to read a file with 1,000,000 lines then GetFileSize(…) will be called 1,000,000 times.
Let’s have a look at another piece of code. This time the following code has quite different runtime behavior.
string[] lines = …
int i = 0;
while (i < lines.Length)
{
   ...
}
In both examples the pattern is the same. And this is exactly what we want. We want to use a well-known and predictive patterns.
Take a look at the following 2 minutes video to see how easy it is to spot and fix such issues (you can find the sample solution at the end of the post).
After all, this is why we want to use such tools – they work for us. It is much easier to fix performance and memory issues in the implementation/construction phase rather than in the test/validation phase of the project iteration.
Being proactive and using profiling tools during the whole ALM will help you to build better products and have happy customers.

