Microsoft recently released the first beta version of Microsoft.Diagnostics.Runtime component. Lee Culver describes ClrMD as follows:
ClrMD is a set of advanced APIs for programmatically inspecting a crash dump of a .NET program much in the same way as the SOS Debugging Extensions (SOS). It allows you to write automated crash analysis for your applications and automate many common debugger tasks.
Lee Culver also showed a nice LINQ query over heap objects. This example reminds me the SharpDevelop approach to Profiler Query Language (PQL). Here is the short description of PQL:
- PQL v1.1 (SharpDevelop 4.x)
- Extend PQL capabilities (Views and Categories)
- PQL code completion and editing improvements
- PQL performance improvements (optimized LINQ implementation LINQ-to-Profiler)
I am very keen on PQL concept and the ClrMD component makes it possible. I decided to have a high-level overview of ClrMD implementation so I loaded the assembly in JustDecompile.
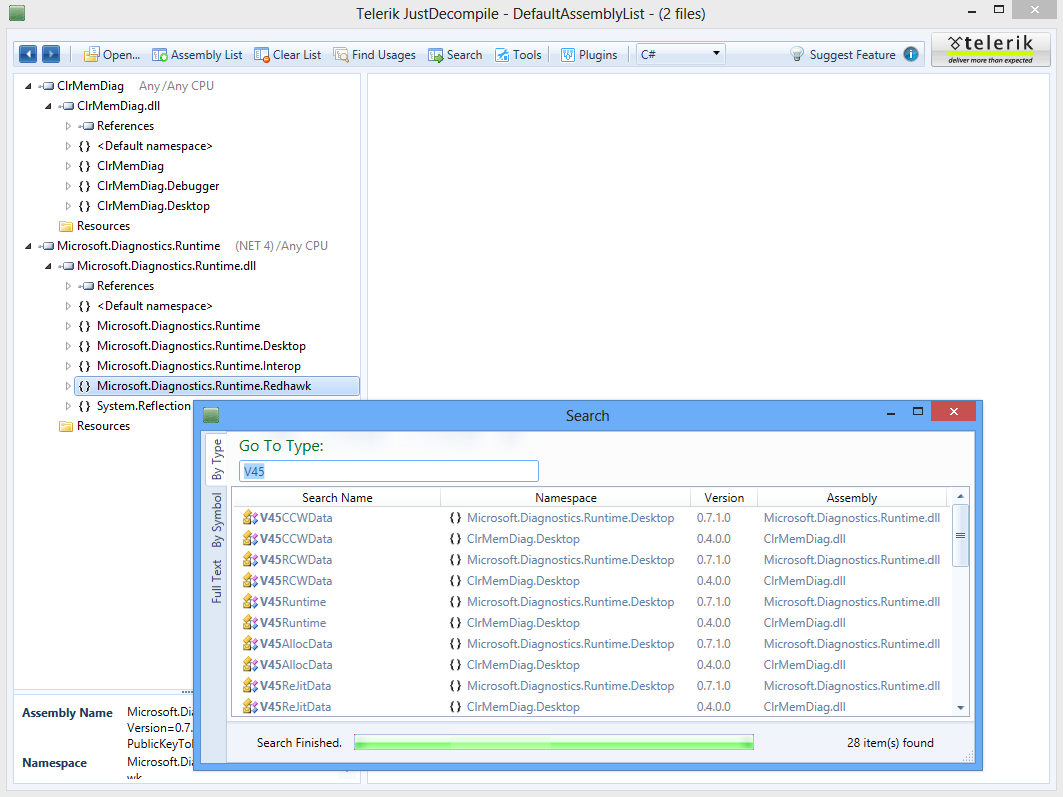
I was not surprised to see that Microsoft reused a lot of code from PerfView which is built around IXCLRDataProcess interface. Actually the latest PerfView version (1.4.1.0) already comes with ClrMD component instead of ClrMemDiag assembly. Something else caught my eye though. This is the Redhawk namespace. And this is a very nice surprise indeed.
For those who are not familiar with Redhawk I would recommend the following Channel 9 page. As far as I know, there is nothing official about Redhawk yet and the ClrMD component might be the first clue. What is coming next? Only time will tell.