Category: .NET

  • Introduction to CLR metadata

    If you are a .NET developer then you’ve probably heard or read about CLR metadata. In this blog post I will try to give you a pragmatic view of what CLR metadata is and how to work with it. You are going to learn how to use unmanaged metadata API from C# code. I will try to keep the blog post brief and clear, so I am going to skip some details where is possible. For more information, please refer to the links at the end.

    A Simple Case Example

    To make things real we will try to solve the following problem. Suppose we have the following interface definition in C#:

    interface IFoo
    {
        string Bar { get; }
        string Baz { set; }
    }

    Our goal is to get the property names (think of System.Reflection.PropertyInfo) with a pretty and fluent syntax in C#. For property Bar the task is trivial:

    IFoo foo = null;
    Expression<Func<string>> expr = () => foo.Bar;
    var pi = (expr.Body as MemberExpression).Member as PropertyInfo;

    In the case when the property has a getter we can leverage the power of C# compiler and use C# expression trees. The things for property Baz are more complicated. Usually, we end up something like this:

    IFoo foo = null;
    Action act = () => foo.Baz = "";

    In this case the compiler emits a new type and the things get ugly because we have to decompile IL code in order to get the property name. As we are going to see, we will use the metadata API for a very simple form of decompilation.

    Background

    The term metadata refers to “data about data”.
    wikipedia

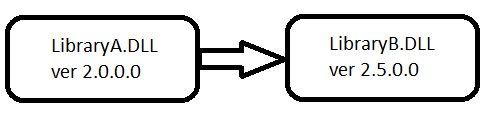
    When it comes to CLR metadata the term metadata refers to what is known as descriptive metadata. I promised that I will be pragmatic, so let’s see a real example. I guess that you, as a .NET developer, know that Microsoft promotes .NET as a platform that solve the problem known as DLL hell. The main argument is that .NET provides a feature called Strong-Name Signing that assigns a unique identity to an assembly. Suppose we have two assemblies LibraryA.DLL and LibraryB.DLL and the former depends on the latter.
    libalibb

    Suppose that during deployment we accidentally deploy LibraryB.DLL version 1.0.0.0 instead of version 2.5.0.0. The next time CLR tries to load the assembly LibraryA.DLL it will detect that we have deployed a wrong version of LibraryB.DLL and will fail with assembly load exception. Let’s see another scenario. You find and fix a bug in assembly LibraryB.DLL and replace the older file with the new one. Your existing assembly LibraryA.DLL continues to work as expected.

    From these two scenarios, it is easy to guess that assembly LibraryA.DLL has enough information about LibraryB.DLL so that the CLR can spot the difference in case of improper deployment. This information comes from the CLR metadata. Assembly LibraryB.DLL has metadata that stores information about it (assembly name, assembly version, public types, etc.). When the compiler generates assembly LibraryA.DLL it stores in its metadata information about assembly LibraryB.DLL.

    The CLR metadata is organized as a normalized relational database. This means that CLR metadata consists of rectangular tables with foreign keys between each other. In case you have previous experience with databases you should be familiar with this concept. Since .NET 2.0 there are more than 40 tables that define the CLR metadata. Here is a sample list of some of the tables:

    • Module (0x00) – contains information about the current module
    • TypeRef (0x01) – contains information about the types that are referenced from other modules
    • TypeDef (0x02) – contains information about the types defined in the current module
    • Field (0x04) – contains information about the fields defined in the current module
    • Method (0x06) – contains information about the methods defined in the current module
    • Property (0x17) – contains information about the properties defined in the current module
    • Assembly (0x20) – contains information about the current assembly
    • AssemblyRef (0x23) – contains information about the referenced assemblies

    We can see that most of the information is organized around the current module. As we will see it soon, this organizational model is reflected in the metadata API. For now, it is important to say that an assembly has one or more modules. The same model is used in System.Reflection API as well. You can read more about it here.

    Internally, the CLR metadata is organized in a very optimized format. Instead of using human readable table names it uses numbers (table identifiers, TIDs). In the table list above the numbers are shown in hexadecimal format. To understand the CLR metadata, we have to know another important concept – Record Index (RID). Let’s have a look at TypeDef table. Each row (record) in TypeDef table describes a type that is defined in the current module. The record indexes are continuously growing starting from 1. The tuple (TID, RID) is enough to unambiguously identify every metadata record in the current module. This tuple is called metadata token. In the current CLR implementation metadata tokens are 4 byte integers where the highest byte is TID and the rest 3 bytes are used for RID. For example, the metadata token 0x02000006 identifies the 6th record from TypeDef table.

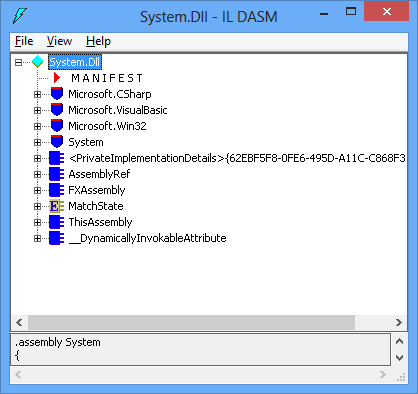
    Let’s see the content of metadata tables. The easiest way is to use ILDASM tool. For the sake of this article I will load System.DLL assembly.
    ildasm0

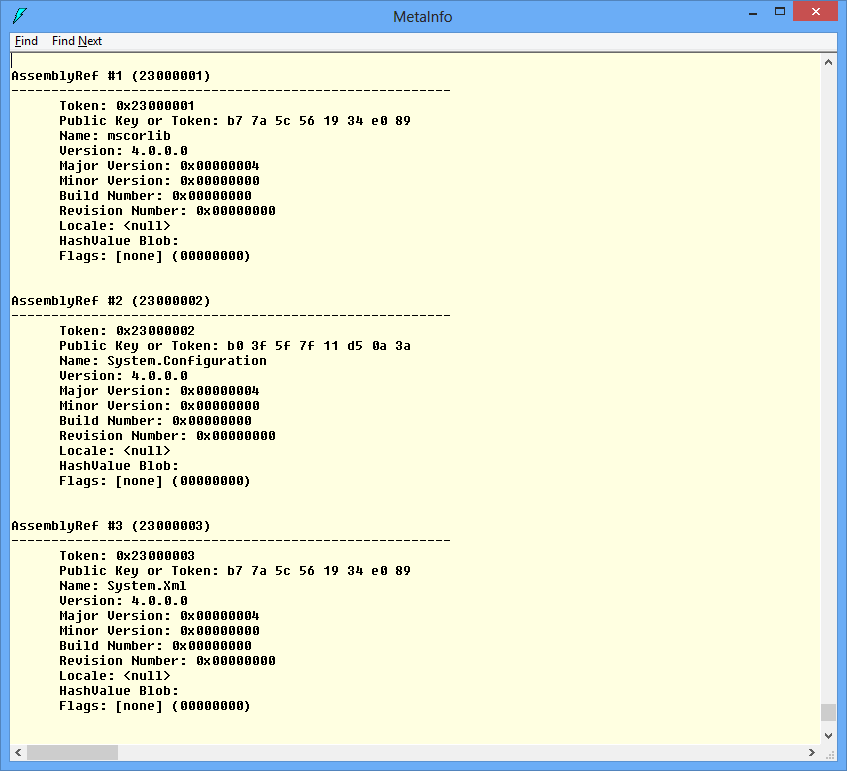
    Once the assembly is loaded you can see the CLR metadata via View->MetaInfo->Show menu item (you can use CTRL+M shortcut as well). It takes some time to load all the metadata. Let’s first navigate to AssemblyRef (0x23) table.
    ildasm2

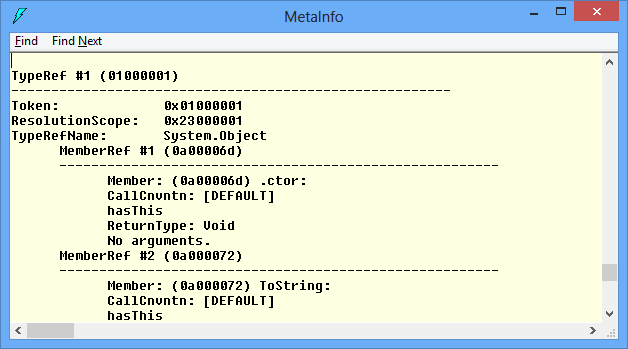
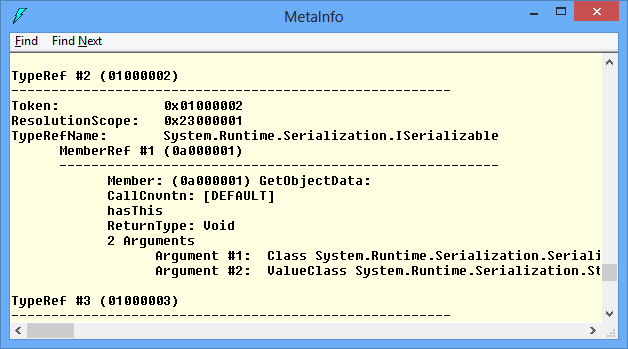
    As we can see the assembly System.DLL refers to 3 other assemblies (mscorlib, System.Configuration and System.Xml). For each row (record), we can see what the actual column (Name, Version, Major, Minor, etc.) values are. Let’s have a look at TypeRef (0x01) table. The first record describes a reference to System.Object type from assembly with token 0x23000001, which is mscorlib (see the screenshot above). The next referred type is System.Runtime.Serialization.ISerializable and so on.
    ildasm3ildasm4
    By now, I hope you understand at high level what CLR metadata is and how it is organized. There are a lot of tricky technical details about the actual implementation, but they are not important for the sake of this article. I encourage you to play with ILDASM and try the different views under View->MetaInfo menu. For more information, please refer to the links at the end.

    Let’s write some code

    Microsoft provides unmanaged (COM based) API to work with metadata. This API is used by debuggers, profilers, compilers, decompilers and other tools. First, we have to obtain an instance of CorMetaDataDispenser which implements IMetaDataDispenserEx interface. Probably, the easiest way is to use the following type definition:

    [ComImport, GuidAttribute("E5CB7A31-7512-11D2-89CE-0080C792E5D8")]
    class CorMetaDataDispenserExClass
    {
    }
    //
    var dispenser = new CorMetaDataDispenserExClass();

    The value “E5CB7A31-7512-11D2-89CE-0080C792E5D8” passed to the GuidAttribute constructor is the string representation of the CLSID_CorMetaDataDispenser value defined in cor.h file from the Windows SDK. Another way to obtain an instance of the metadata dispenser is through Type/Activator collaboration:

    Guid clsid = new Guid("E5CB7A31-7512-11D2-89CE-0080C792E5D8");
    Type dispenserType = Type.GetTypeFromCLSID(clsid);
    object dispenser = Activator.CreateInstance(dispenserType);

    Either way, we cannot do much with the dispenser instance right now. As we said earlier, we need an instance of IMetaDataDispenserEx interface, so let’s cast it to IMetaDataDispenserEx interface:

    var dispenserEx = dispenser as IMetaDataDispenserEx;

    The CLR will do QueryInterface for us and return the right interface type. Let’s see IMetaDataDispenserEx definition:

    [ComImport, GuidAttribute("31BCFCE2-DAFB-11D2-9F81-00C04F79A0A3"), InterfaceType(ComInterfaceType.InterfaceIsIUnknown)]
    interface IMetaDataDispenserEx
    {
        uint DefineScope(ref Guid rclsid, uint dwCreateFlags, ref Guid riid, out object ppIUnk);
    
        uint OpenScope(string szScope, uint dwOpenFlags, ref Guid riid, out object ppIUnk);
    
        uint OpenScopeOnMemory(IntPtr pData, uint cbData, uint dwOpenFlags, ref Guid riid, out object ppIUnk);
    
        uint SetOption(ref Guid optionid, object value);
    
        uint GetOption(ref Guid optionid, out object pvalue);
    
        uint OpenScopeOnITypeInfo(ITypeInfo pITI, uint dwOpenFlags, ref Guid riid, out object ppIUnk);
    
        uint GetCORSystemDirectory(char[] szBuffer, uint cchBuffer, out uint pchBuffer);
    
        uint FindAssembly(string szAppBase, string szPrivateBin, string szGlobalBin, string szAssemblyName, char[] szName, uint cchName, out uint pcName);
    
        uint FindAssemblyModule(string szAppBase, string szPrivateBin,string szGlobalBin, string szAssemblyName, string szModuleName, char[] szName, uint cchName, out uint pcName);
    }

    For the sake of readability, I removed all the marshaling hints that the CLR needs when doing the COM interop. Let’s see some of the details in this interface definition. The value “31BCFCE2-DAFB-11D2-9F81-00C04F79A0A3” is the string representation of IID_IMetaDataDispenserEx value defined in cor.h file from the Windows SDK. For the purpose of this article we are going to call the following method only:

    uint OpenScope(string szScope, uint dwOpenFlags, ref Guid riid, out object ppIUnk);

    Here goes the method description from the MSDN documentation:

    • szScope – The name of the file to be opened. The file must contain common language runtime (CLR) metadata
    • dwOpenFlags – A value of the CorOpenFlags enumeration to specify the mode (read, write, and so on) for opening
    • riid – The IID of the desired metadata interface to be returned; the caller will use the interface to import (read) or emit (write) metadata. The value of riid must specify one of the “import” or “emit” interfaces. Valid values are IID_IMetaDataEmit, IID_IMetaDataImport, IID_IMetaDataAssemblyEmit, IID_IMetaDataAssemblyImport, IID_IMetaDataEmit2, or IID_IMetaDataImport2
    • ppIUnk – The pointer to the returned interface

    The most interesting parameter is the third one (riid). We have to pass the GUID of the interface we want to get. In our case this is IMetaDataImport  interface (import interfaces are used to read metadata while emit interfaces are used to write metadata).

    So, to obtain an instance of IMetaDataImport  interface we have to find its GUID from cor.h file and call OpenScope method:

    Guid metaDataImportGuid = new Guid("7DAC8207-D3AE-4c75-9B67-92801A497D44");
    object rawScope = null;
    var hr = dispenserEx.OpenScope("myAssembly.dll", 0, ref metaDataImportGuid, out rawScope);
    var import = rawScope as IMetaDataImport;

    Finally, we have an instance of IMetaDataImport interface. Because the interface has more than 60 methods I present here only the methods we are going to use:

    [ComImport, GuidAttribute("7DAC8207-D3AE-4C75-9B67-92801A497D44"), InterfaceType(ComInterfaceType.InterfaceIsIUnknown)]
    interface IMetaDataImport
    {
        void CloseEnum(IntPtr hEnum);
    
        uint GetScopeProps(char[] szName, uint cchName, out uint pchName, ref Guid pmvid);
    
        uint GetTypeRefProps(uint tr, out uint ptkResolutionScope, char[] szName, uint cchName, out uint pchName);
    
        uint ResolveTypeRef(uint tr, ref Guid riid, out object ppIScope, out uint ptd);
    
        uint EnumMethods(ref IntPtr phEnum, uint cl, uint[] rMethods, uint cMax, out uint pcTokens);
    
        uint GetMethodProps(uint mb, out uint pClass, char[] szMethod, uint cchMethod, out uint pchMethod, out uint pdwAttr, out IntPtr ppvSigBlob, out uint pcbSigBlob, out uint pulCodeRVA, out uint pdwImplFlags);
    
        uint GetMemberRefProps(uint mr, out uint ptk, char[] szMember, uint cchMember, out uint pchMember, out IntPtr ppvSigBlob, out uint pbSigBlob);
    
        // for brevity, the rest of the methods are omitted
    }

    Probably the most interesting methods are GetMethodProps and GetMemberRefProps. The first method takes MethodDef token as a first parameter while the second method takes MemberRef token. As we know, MethodDef tokens are stored in Method (0x02) table and MemberRef tokens are stored in MemberRef (0x0a) table. The first ones describe methods defined in the current module while the second ones describe methods (and members) referenced from other modules.

    At first sight there is not much difference between MethodDef and MemberRef tokens, but as we are going to see the difference is crucial. Let’s have a look at the following code fragment:

    Expression<Func<bool>> expr = () => string.IsNullOrEmpty("");
    MethodInfo mi = (expr.Body as MethodCallExpression).Method;
    int methodDef = mi.MetadataToken;

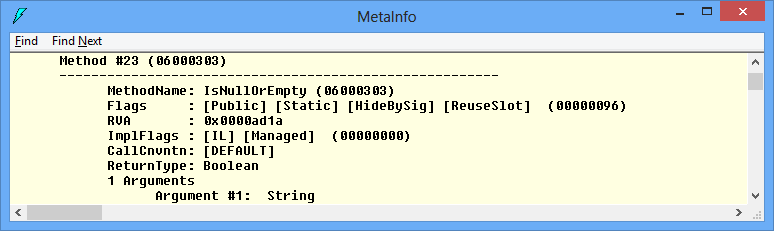
    The sole purpose of this code is to obtain the MethodDef token of IsNullOrEmpty method. At first it may not be obvious but MetadataToken property returns the MethodDef token of that method. On my machine the actual token value is 0x06000303. So, the table name is MethodDef (0x06) and the RID is 0x303. A quick check with ILDASM tool confirms it:
    ildasm5

    Let’s experiment and execute the following code fragment:

    Type[] mscorlibTypes = typeof(string).Assembly.GetTypes();
    var q = from type in mscorlibTypes
            from method in type.GetMethods()
            where method.MetadataToken == 0x06000303
            select method;
    
    MethodInfo mi2 = q.SingleOrDefault();
    // "same" is true
    bool same = object.ReferenceEquals(mi, mi2);

    So, our strategy is to get the MethodDef token of the property setter and then run a LINQ query similar to the one shown above. In reality the code is more complex:

    private static MethodInfo GetMethodInfoFromScope(uint token, Assembly assemblyScope, Guid mvid)
    {
        MethodInfo mi = null;
    
        if ((token != mdTokenNil) && (assemblyScope != null) && (mvid != Guid.Empty))
        {
            const BindingFlags flags = BindingFlags.Static | BindingFlags.Instance | BindingFlags.Public | BindingFlags.NonPublic;
    
            var q = from module in assemblyScope.Modules
                    from type in module.GetTypes()
                    from method in type.GetMethods(flags)
                    where (method.MetadataToken == token)
                           && (method.Module.ModuleVersionId == mvid)
                    select method;
    
            mi = q.SingleOrDefault();
        }
    
        return mi;
    }

    Because tokens are unique inside a module only, we have to iterate over all assembly modules and find the right one. Fortunately, each module has version id (module version ID, MVID) which is a unique GUID generated during compilation. For example, the module CommonLanguageRuntimeLibrary from mscorlib assembly installed on my machine has the following MVID “AD977517-F6DA-4BDA-BEEA-FFC184D5CD3F”.

    ildasm6

    We can obtain MVID via GetScopeProps method from IMetaDataImport interface.

    So far we saw how to get a MethodInfo object for any method (including property setters) if we know the MethodDef token and the MVID of the containing module. However, we still don’t know how to proceed in case of MemberRef token. The solution is to find the original MethodDef token.

    Here is the high level algorithm we have to follow:

    1. Call GetMemberRefProps to get the method name and the TypeRef token of the containing type (this is the second method parameter ptk)
    2. If TypeRef is a nested type, call GetTypeRefProps as many times as needed to get the most outer TypeRef
    3. Call ResolveTypeRef to get IMetaDataImport interface for the module that contains the corresponding TypeDef token
    4. Call EnumMethods for the TypeDef token from previous step
    5. For each MethodDef from previous step, call GetMethodProps to get its name, compare it with the name from step 1 and if they match return the current MethodDef token

    This algorithm can be used for any method MemberRef, not just property setters. The only potential pitfall is the string comparison in the last step. As you know, the CLR supports method overloading. Fortunately, the current .NET compilers with property support don’t allow property overloading. Even if that was the case, we can use some of the flags returned by GetMemberRefProps for unambiguous method resolution.

    Here is a high level skeleton of the algorithm:

    uint methodRef = 0;
    IMetaDataImport import = null;
    
    uint typeRef;
    uint memberRefNameLen = 0;
    uint memberRefSigLen;
    var memberRefName = new char[1024];
    IntPtr ptrMemberRefSig;
    var hr = import.GetMemberRefProps(methodRef, out typeRef, memberRefName, (uint)memberRefName.Length, out memberRefNameLen, out ptrMemberRefSig, out memberRefSigLen);
    
    var name = new string(memberRefName, 0, (int)memberRefNameLen - 1);
    
    uint resScope;
    uint parentNameLen;
    hr = import.GetTypeRefProps(typeRef, out resScope, null, 0, out parentNameLen);
    
    uint typeDef = mdTokenNil;
    object newRawScope = null;
    Guid metaDataImportGuid = new Guid(IID_IMetaDataImport);
    hr = import.ResolveTypeRef(typeRef, ref metaDataImportGuid, out newRawScope, out typeDef);
    
    var newImport = newRawScope as IMetaDataImport;
    
    var hEnum = IntPtr.Zero;
    var methodTokens = new uint[1024];
    var methodName = new char[1024];
    uint len;
    hr = newImport.EnumMethods(ref hEnum, typeDef, methodTokens, (uint)methodTokens.Length, out len);
    
    for (var i = 0; i < len; i++)
    {
        uint tmpTypeDef;
        uint attrs;
        var sig = IntPtr.Zero;
        uint sigLen;
        uint rva;
        uint flags;
        uint methodNameLen;
        hr = newImport.GetMethodProps(methodTokens[i], out tmpTypeDef, methodName, (uint)methodName.Length, out methodNameLen, out attrs, out sig, out sigLen, out rva, out flags);
    
        var curName = new string(methodName, 0, (int)methodNameLen - 1);
    
        if (name == curName)
        {
            // found methodDef
            break;
        }
    }

    The actual implementation is more complex. There are two tricky details:

    1. TypeRef resolution from step 2, in case TypeRef token is a token of a nested type
    2. The assemblyScope parameter in GetMethodInfoFromScope method

    To solve the first issue we can simply use a stack data structure. We push all TypeRef tokens from GetTypeRefProps method. Then we pop the tokens and resolve them with ResolveTypeRef method. The second issue may not be obvious. We have to pass an assembly instance to GetMethodInfoFromScope method. However the metadata API does not require the CLR loader to load the assembly (in an AppDomain). In a matter of fact the metadata API does not require CLR to be loaded at all. So we have to take care and load the assembly if needed:

    newAssembly = AppDomain.CurrentDomain.GetAssemblies().FirstOrDefault(a => a.GetName().FullName.Equals(asmName.FullName));
    if (newAssembly == null)
    {
        newAssembly = Assembly.Load(asmName);
    }
    // pass newAssembly to GetMethodInfoFromScope(...) method

    So far, we worked mostly with modules but right now we have to find an assembly by name. This means that we have to obtain the assembly name from the current module. For this purpose we are going to use IMetaDataAssemblyImport interface. This interface has more than a dozen methods, but for the sake of this article we are going to use two methods only:

    [ComImport, GuidAttribute("EE62470B-E94B-424E-9B7C-2F00C9249F93"), InterfaceType(ComInterfaceType.InterfaceIsIUnknown)]
    interface IMetaDataAssemblyImport
    {
        uint GetAssemblyFromScope(out uint ptkAssembly);
    
        uint GetAssemblyProps(uint mda,
                                out IntPtr ppbPublicKey,
                                out uint pcbPublicKey,
                                out uint pulHashAlgId,
                                char[] szName,
                                uint cchName,
                                out uint pchName,
                                out ASSEMBLYMETADATA pMetaData,
                                out uint pdwAssemblyFlags);
    
        // for brevity, the rest of the methods are omitted
    }

    To obtain an instance of IMetaDataAssemblyImport interface we have to cast it from existing an instance of IMetaDataImport interface:

    var asmImport = import as IMetaDataAssemblyImport;

    Again, the CLR will do QueryInterface for us and return the proper interface. Once we have an instance of IMetaDataAssemblyImport interface we use it as follows:

    1. Call GetAssemblyFromScope to obtain the current assemblyId
    2. Call GetAssemblyProps with the assemblyId from the previous step

    Until now, we saw how to use the metadata API from C#. One question left unanswered though. How can we get MethodDef or MemberRef token? At the beginning we started with a simple delegate, so we can use it to get the byte array of IL instructions that represent the method body:

    Action act = () => foo.Baz = "";
    byte[] il = act.Method.GetMethodBody().GetILAsByteArray();

    It is important to recall that our goal is to decompile the method body of the method pointed by this delegate. This method has a few instructions, it simply calls the property setter with some value. We are not going to do any kind of control flow analysis. All we are going to do is to find the last method invocation (in our case the property setter) inside the method body.

    Almost every method call in the CLR is done through call or callvirt instruction. Both instructions take a method token as a single parameter. All we have to do is parse the IL byte array for call or callvirt instruction and interpret the next 4 bytes as a method token. We then check whether the token is MethodDef or MemberRef and if this is the case we pass it to the metadata API.

    I hope this article gave you an idea what metadata API is and how to use it from C#. I tried to focus on the interfaces needed for solving our specific scenario. The metadata API has much more functionality than what we saw here. It allows you to emit new methods, new types and new assemblies as well.

    Source Code

    MetadataDemo.zip

    References


  • Analyzing crash dumps with ClrMD

    Microsoft recently released the first beta version of Microsoft.Diagnostics.Runtime component. Lee Culver describes ClrMD as follows:

    ClrMD is a set of advanced APIs for programmatically inspecting a crash dump of a .NET program much in the same way as the SOS Debugging Extensions (SOS). It allows you to write automated crash analysis for your applications and automate many common debugger tasks.

    Lee Culver also showed a nice LINQ query over heap objects. This example reminds me the SharpDevelop approach to Profiler Query Language (PQL). Here is the short description of PQL:

    •  PQL v1.1 (SharpDevelop 4.x)
      •  Extend PQL capabilities (Views and Categories)
      •  PQL code completion and editing improvements
      •  PQL performance improvements (optimized LINQ implementation LINQ-to-Profiler)

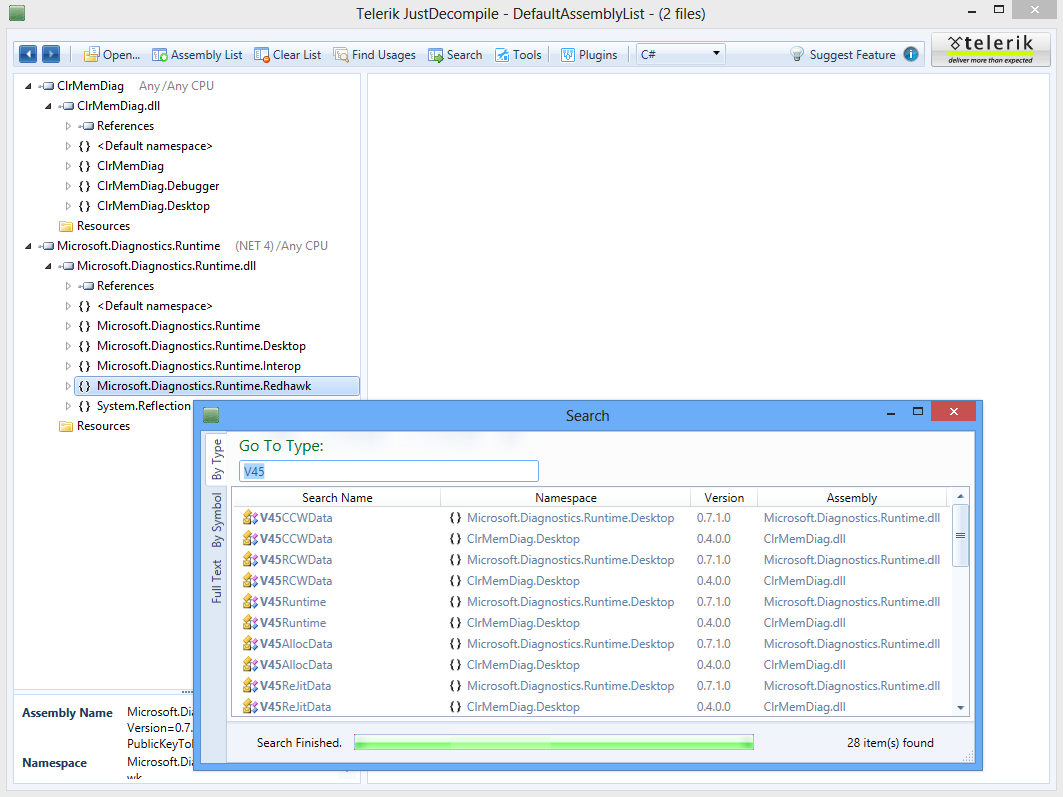
    I am very keen on PQL concept and the ClrMD component makes it possible. I decided to have a high-level overview of ClrMD implementation so I loaded the assembly in JustDecompile.

    clrmd1

    I was not surprised to see that Microsoft reused a lot of code from PerfView which is built around IXCLRDataProcess interface. Actually the latest PerfView version (1.4.1.0) already comes with ClrMD component instead of ClrMemDiag assembly. Something else caught my eye though. This is the Redhawk namespace. And this is a very nice surprise indeed.

    For those who are not familiar with Redhawk I would recommend the following Channel 9 page. As far as I know, there is nothing official about Redhawk yet and the ClrMD component might be the first clue. What is coming next? Only time will tell.

  • Parsing “Unsafe” Method Signatures

    If you’ve ever used JustMock then you should be familiar with code fragments like this one:

    public interface IFoo
    {
        byte Bar(int i, string s, long l);
    }
    
    var foo = Mock.Create<IFoo>();
    Mock.Arrange(() => foo.Bar(123, "test", 321)).Returns(5);

    The interesting thing in this code is in the Arrange method. Its signature is as follows:

    public static FuncExpectation<TResult> Arrange<TResult>(Expression<Func<TResult>> expression)

    The method accepts a single parameter of Expression<TDelegate> type. This allows JustMock to parse the actual method name and the parameter values. In this blog post I am going to show you a simple and yet effective approach for parsing methods that contain pointer parameters.

    Lets make our example more interesting.

    public unsafe interface IFoo
    {
        byte** Bar(int* i, string s, ref long* l);
    }

    Because Expression<TDelegate> expects a delegate type as a type parameter we can define a new delegate type and use it to construct a proper expression object.

    public unsafe delegate byte** BarDel();
    //..
    int* pi = (int*)IntPtr.Zero;
    long* pl = (long*)IntPtr.Zero;
    Expression<BarDel> expr = () => Bar(pi, "test", ref pl);

    This is all good and nice. Now we can change Arrange method signature as follows:

    // to keep it simple, we changed the return type to void
    public static void Arrange<TDelegate>(Expression<TDelegate> expr) { }
    //..
    int* pi = (int*)IntPtr.Zero;
    long* pl = (long*)IntPtr.Zero;
    Mock.Arrange<BarDel>(() => Bar(pi, "test", ref pl));

    The only thing that left is to make the return type independent from the return type of the actual Bar method. This is easy. A pointer to a pointer to a byte (byte**) is just… a pointer! The only tricky thing is that JustMock doesn’t know what actual type is pointed. So, it is a sane decision to leave this knowledge to the unit test author. We need a simple generalization over IntPtr type and that’s all.

    namespace Telerik.JustMock
    {
        public class PtrBase
        {
            private readonly IntPtr addr;
    
            protected PtrBase(IntPtr addr)
            {
                this.addr = addr;
            }
    
            public IntPtr Addr { get { return this.addr; } }
        }
    
        public delegate T PtrDel<T>() where T : PtrBase;
    }

    Now, we have to change Arrange method as follows:

    public static void Arrange<TPtr>(Expression<PtrDel<TPtr>> expr, params TPtr[] arr)
        where TPtr : PtrBase
    {
        var methodCallExpr = (expr.Body as UnaryExpression).Operand as MethodCallExpression;
    
        // process methodCallExpr
    }

    Lets see how we have to change our test code so we can call the new Arrange method. Now, we have to take care for all pointers and convert them. This is a trivial task:

    public class Ptr : PtrBase
    {
        private Ptr(IntPtr addr) : base(addr) { }
    
        public unsafe static implicit operator Ptr(int* ptr)
        {
            return new Ptr(new IntPtr(ptr));
        }
    
        public unsafe static implicit operator Ptr(long* ptr)
        {
            return new Ptr(new IntPtr(ptr));
        }
    
        public unsafe static implicit operator Ptr(byte** ptr)
        {
            return new Ptr(new IntPtr(ptr));
        }
    }

    Finally, we have to change our Arrange method invocation:

    int* pi = (int*)IntPtr.Zero;
    long* pl = (long*)IntPtr.Zero;
    Mock.Arrange<Ptr>(() => Foo(pi, "test", ref pl), pi, pl);

    The code can be improved in many ways. One way to improve it is to replace PtrDel<T> with Func<TResult> though I prefer the explicit constraint on PtrBase. Another way to improved the code is by making PtrBase abstract type and providing a template method that will be called inside the Arrange method, so the actual value can be retrieved. Here is a simple implementation:

    namespace Telerik.JustMock
    {
        public abstract class PtrBase
        {
            private readonly IntPtr addr;
            private readonly int cookie;
    
            protected PtrBase(IntPtr addr, int cookie)
            {
                this.addr = addr;
                this.cookie = cookie;
            }
    
            public IntPtr Addr { get { return this.addr; } }
            public int Cookie { get { return this.cookie; } }
    
            public abstract object ReadValue();
        }
    }

    When you create a new type which inherits from PtrBase type you should provide a unique cookie for each pointer type (e.g. 1 for int*, 2 for long*, 3 for byte**, etc.). When Arrange method is called, it will call in turn your implementation of ReadValue method and use the return value. In a matter of fact we don’t need this cookie mechanism because we can get the actual pointer type from methodCallExpr variable. The real purpose of ReadValue is to allow execution of user defined code in a lazy fashion. In case you don’t want this feature you can read the actual pointed value inside Ptr implicit conversion operator implementation and pass it to PtrBase constructor.

  • JustMock Design Choices

    JustMock is a small product. It is around 10,000 lines of code. Despite its small size there are a lot of decisions that were made and many others that have to be made. In this post I would like to shed some light on our decision making process and I’ll try to answer the question why JustMock is built the way it is. The topic is quite large for a single blog post so I am going to focus on small part from JustMock – namely design choices for private method resolution.

    First, I would like to emphasize that JustMock was built around C#. Every time when we had to decide how particular feature should be implemented we designed it from C# perspective. As a result JustMock works with concepts that are better expressed in C# rather than VB.NET for example. The reason for this decision is that it seems C# developers tend to use more often mocking tools/frameworks than VB.NET ones. So far, it seems we did the right choice.

    As a consequence JustMock is more or less tightly coupled to the C# compiler. So are other mocking libraries. Lets consider the following example with Moq:

        public interface IFoo
        {
            int Bar(string s);
            int Bar(StringBuilder s);
        }

    Often, it makes sense to define overloading methods in your code. The way IFoo is defined is perfectly legal. So, lets see a corner case with this interface. Suppose we want to mock Bar(string s) method when the argument is null:

        var mock = new Mock<IFoo>();
        mock.Setup(foo => foo.Bar(null)).Returns(1);

    You will quickly find that the this code fragment does not compile. Here goes the error:

    error CS0121: The call is ambiguous between the following methods or properties:
    'IFoo.Bar(string)' and 'IFoo.Bar(System.Text.StringBuilder)'

    This error has nothing to do with Moq. It is related to the C# compiler which in this case does not have enough information how to do method resolution. So, it is our fault and we have to fix it.

    Here comes the second guide line we follow when design JustMock – there are no “right” or “wrong” choices. It is not white or black; rather it is like different gray shades. We could employ C# syntax in JustMock API to provide single method resolution (in most cases) but we didn’t. The reason is that different C# developers have different strategies to correct this issue. Here is a sample list with the most common fixes:

        // option 1
        mock.Setup(foo => foo.Bar((string)null)).Returns(1);
    
        // option 2
        mock.Setup(foo => foo.Bar(null as string)).Returns(1);
    
        // option 3
        mock.Setup(foo => foo.Bar(default(string))).Returns(1);
    
        // option 4
        string s = null;
        mock.Setup(foo => foo.Bar(s)).Returns(1);

    After all, it’s matter of taste. Please notice that while I provided the sample above with Moq the issue is valid for JustMock. Lets make the things more interesting. Suppose we have the following concrete type:

        public sealed class Foo
        {
            public Foo() { ... }
            // ...
            private int Bar(string s) { ... }
            private int Bar(StringBuilder s) { ... }
        }

    This time Bar(string s) and Bar(StringBuilder s) are private methods in a sealed type. Now we have to design an API for mocking private methods.

    Note: Mocking private methods is a controversial thing. There are two equally large camps and a hot discussion between them. For good or bad, JustMock offers this feature.

    We can provide the following method:

        public static void Arrange(object instance, string methodName, params object[] args) 
        { ... }

    And then use it as follows:

        var foo = Mock.Create<Foo>();
        Mock.Arrange(foo, "Bar", null);
    
        string s = null;
        int actual = foo.Bar(s);

    The problem with this approach is that the last argument passed to Arrange method is null and thus we cannot resolve the correct Bar(…) method. This time options 1 to 4 provided above don’t solve the issue. Lets see what can we do.

    Approach 1: no method resolution

    The problem is all about method resolution so if we don’t have to do it then we are good. Lets provide the API:

        public static void Arrange(object instance, MethodInfo method, params object[] args)
        { ... }

    We have to change our test code:

        Type[] argTypes = { typeof(string) };
        var bar = typeof(Foo).GetMethod("Bar", argTypes);
    
        var foo = Mock.Create<Foo>();
        Mock.Arrange(foo, bar, null);

    The test code is more messy. Now we have to deal with System.Reflection stuff which is not related to our code. Some developers are fine with this approach though. While this approach is suitable for API-to-API scenarios a lot of people prefer something more “friendly”.

    Approach 2: pass method parameter types

    We can pass the actual parameter types along with the parameter values. Lets change the Arrange method signature:

        public static void Arrange(object instance, string methodName, Type[] types, params object[] args) 
        { ... }

    We added Type[] argument to Arrange method so we have to change our test code:

        var foo = Mock.Create<Foo>();
        Type[] argTypes = { typeof(string) };
        Mock.Arrange(foo, "Bar", argTypes, null);
    
        // use foo instance

    This solution is easy to understand. It can also handle ref and out parameters and other more complex scenarios.

    Approach 3: pass method parameter types as generic parameters

    In case we decide to support private methods with simple signatures (no ref and out parameters and other fancy stuff) we can modify our previous approach by providing generic version of Arrange method (we can use T4 template for code generation; for the sake of simplicity we add a single generic parameter):

        public static void Arrange<T>(object instance, string methodName, params object[] args) 
        { ... }

    We change our test code accordingly to:

        var foo = Mock.Create<Foo>();
        Mock.Arrange<string>(foo, "Bar", null);
    
        // use foo instance

    This all looks good and nice but now we have to provide generic parameter types even when we don’t need them.

        var foo = Mock.Create<Foo>();
        Mock.Arrange<string>(foo, "Bar", "test");
    
        // use foo instance

    It is not that bad but this can be annoying if Bar(…) method accepts, lets say, 5 integer parameters.

    Approach 4: use typed references

    The CLR and .NET framework already provide support for typed references but for our need we can come up with something much simpler. We have to provide support for our corner case when values are null. So we can provide a simple Null<T> type as follows:

        public sealed class Null<T>
            where T : class
        {
        }

    Every time when we have to pass null value we are going to replace it with an instance of Null<T> type:

        var foo = Mock.Create<Foo>();
        Mock.Arrange(foo, "Bar", new Null<string>());
    
        // use foo instance

    As the previous approach this one does not support methods with ref and out parameters. We can try to fix it by providing another constructor for Null<T> type:

        public sealed class Null<T>
            where T : class
        {
            public Null() {}
    
            public Null(System.Reflection.ParameterAttributes attrs)
            {
                this.Attrs = attrs;
            }
    
            public ParameterAttributes Attrs { get; private set; }
        }

    Suppose we add the following method to Foo:

        private int Bar(ref string s) { ... }

    If we want to mock it then our test code should like something like:

        var foo = Mock.Create<Foo>();
        Mock.Arrange(foo, "Bar", new Null<string>(ParameterAttributes.Out));
    
        // use foo instance

    It doesn’t look nice to me. The syntax becomes more verbose and doesn’t flow naturally. We can mitigate it by adding new helper type as follows:

        public static class Arg
        {
            public static Null<T> Null<T>()
                where T : class
            {
                return new Null<T>();
            }
        }

    Now we can compare the two options

        var foo = Mock.Create<Foo>();
    
        //option 1
        Mock.Arrange(foo, "Bar", new Null<string>());
    
        //option 2
        Mock.Arrange(foo, "Bar", Arg.Null<string>());
    
        // use foo instance

    The readability seems a little bit better but many developers find the syntax verbose.

    Approach 5: using dynamic (C# 4 and higher)

    This is a good approach for a lot of developers. There is a caveat though. There are a plenty of customers that are still using .NET 3.5 and earlier. Shall we abandon them? A tough question.

    Which one to use?

    First, it is a wrong question. There is no silver bullet and the best thing we can do is to decide on a case-by-case basis. So far, we saw a few possible options; there are other alternatives as well. The options are not mutually exclusive which makes it even harder. If you are curious how we implemented it you can download a trial JustMock version.

  • RVA Static Fields

    In JustTrace Q1 2013 we added support for analyzing GC roots that are static fields. The implementation of this feature uses ICorProfilerInfo2::GetAppDomainStaticAddress,  ICorProfilerInfo2::GetThreadStaticAddress and so on. Among all these methods, there is a very interesting one, namely ICorProfilerInfo2::GetRVAStaticAddress. In this post I am going to focus on a little known CLR feature that is closely related to this method.

    What I find so interesting in ICorProfilerInfo2::GetRVAStaticAddress method is the RVA abbreviation. It stands for relative virtual address. Here is the definition from Microsoft PE and COFF Specification:

    In an image file, the address of an item after it is loaded into memory, with the base address of the image file subtracted from it. The RVA of an item almost always differs from its position within the file on disk (file pointer).

    Once we know what RVA is, we can make a few reasonable guesses about RVA static fields. Since RVA should be known at compile/link time, it is reasonable to guess that the static field should be a value type and should not contain any reference types. We can use the same argument so that any RVA field should be static since it does not make sense to have multiple instance fields occupying the same RVA.

    Lets try find out whether our guesses are correct. Because VB.NET\C# can specify only application domain static and thread static fields we should look at Standard ECMA-335. We are interested in RVA static fields, so it makes sense to look at the field definition specification (II.16 Defining and referencing fields)

    Field ::= .field FieldDecl
    FieldDecl ::=
    [ ‘[’ Int32 ‘]’ ] FieldAttr* Type Id [ ‘=’ FieldInit | at DataLabel ]

    The interesting thing here is the at clause. This clause is used together with a DataLabel, so we have to find out what DataLabel is. Reading the document further we can see that II.16.3 Embedding data in a PE file paragraph starts with the following words:

    There are several ways to declare a data field that is stored in a PE file. In all cases, the .data directive is used.

    The good thing is that the document provides the following example code:

    .data theInt = int32(123)
    .data theBytes = int8 (3) [10]

    After reading a little bit further we find the following text:

    […]In this case the data is laid out in the data area as usual and the static variable is assigned a particular RVA (i.e., offset from the start of the PE file) by using a data label with the field declaration (using the at syntax).

    This mechanism, however, does not interact well with the CLI notion of an application domain (see Partition I). An application domain is intended to isolate two applications running in the same OS process from one another by guaranteeing that they have no shared data. Since the PE file is shared across the entire process, any data accessed via this mechanism is visible to all application domains in the process, thus violating the application domain isolation boundary.

    Now, we know enough about RVA static fields so lets create a test scenario. I tried to keep it as simple as possible. I decided to create a console app that uses a class library, so I can replace the class library assembly with different implementation. Here is the source code for the console app:

    using System;
    
    namespace ConsoleApplication1
    {
        class Program
        {
            static void Main(string[] args)
            {
                PrintStaticVar();
    
                AppDomain app = AppDomain.CreateDomain("MyDomain");
                app.DoCallBack(PrintStaticVar);
    
                AppDomain.Unload(app);
            }
    
            unsafe static void PrintStaticVar()
            {
                fixed (int* p = &ClassLibrary1.Class1.MyInt)
                {
                    IntPtr ptr = new IntPtr(p);
                    Console.WriteLine("app {0}, static {1:X}, addr {2:X}",
                                    AppDomain.CurrentDomain.FriendlyName,
                                    ClassLibrary1.Class1.MyInt,
                                    ptr.ToInt64());
                }
            }
        }
    }

    As you can see, it prints the value and the address of MyInt static variable and it does so for the two application domains. Here is the source code for the class library:

    using System;
    
    namespace ClassLibrary1
    {
        public class Class1
        {
            public static int MyInt = 0x11223344;
        }
    }

    The output from running the console app is as follows:

    app ConsoleApplication1.exe, static 11223344, addr AF3C74
    app MyDomain, static 11223344, addr E23EAC
    Press any key to continue . . .

    As you can see, the app prints unique address for each application domain. Now, it is time to provide different implementation for ClassLibrary1. This time we should write it in ILAsm:

    .assembly extern mscorlib
    {
      .publickeytoken = (B7 7A 5C 56 19 34 E0 89)
      .ver 4:0:0:0
    }
    .assembly ClassLibrary1
    {
      .ver 1:0:0:0
    }
    
    .data MyInt_Data = int32(0x11223344)
    
    .class public auto ansi ClassLibrary1.Class1
    	extends [mscorlib]System.Object
    {
      .field public static int32 MyInt at MyInt_Data
    }

    The last thing we have to do is to run the console app once again. Here is output:

    app ConsoleApplication1.exe, static 11223344, addr 7A4000
    app MyDomain, static 11223344, addr 7A4000
    Press any key to continue . . .

    As expected, this time the app prints the same address for both application domains. If you run the following command

    dumpbin.exe /all ClassLibrary1.dll

    and examine the output then you should see something similar

    SECTION HEADER #2
      .sdata name
           4 virtual size
        4000 virtual address (00404000 to 00404003)
         200 size of raw data
         600 file pointer to raw data (00000600 to 000007FF)
           0 file pointer to relocation table
           0 file pointer to line numbers
           0 number of relocations
           0 number of line numbers
    C0000040 flags
             Initialized Data
             Read Write
    
    RAW DATA #2
      00404000: 44 33 22 11                                      D3".
    
      Summary
    
            2000 .sdata

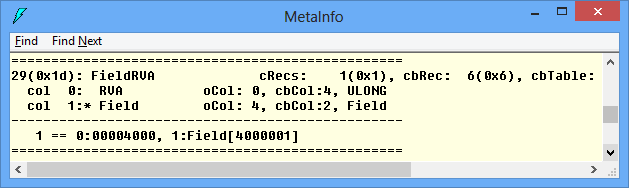
    We can see that the ILAsm compiler emitted MyInt_Data value in the .sdata section. Cross checking with ILDasm only assures us that FieldRVA table contains the correct RVA.rvastaticfield

    Lets check our guess that RVA static fields should be value type only. It is easy to modify our code by adding the following lines appropriately:

    .data MyString_Data = char*("test")
    //...
    .field public static string MyString at MyString_Data

    If you try to run the console app again you will get System.TypeLoadException.

    In closing, I think RVA static fields are little known CLR feature because they aren’t very useful. It is good know that the CLR has this feature but I guess its practical usage is limited.


  • Profiler types and their overhead

    It is a common opinion that profiling tools are slow. Every time I stumble upon this statement I ask for the definition of slow. Most of the time I get the answer that a profiler is slow when it adds more than 100% overhead.

    At present there many commercial profilers that are fast (according to the definition above). So, why don’t people use profiling tools then?

    I think the confusion comes from the fact that there are different profiler types and some of them are fast while others are slow. Lets see what these profiler types are. It is common to classify profiling tools into two major categories:

    • memory profilers
    • performance profilers

    Memory profilers are used when one wants to solve memory related issues like memory leaks, high memory consumption and so on. Performance profilers are used when one wants to solve performance related issues like high CPU usage or concurrency related problems. These categories are not set in stone though. For example too much memory allocation/consumption can cause performance issues.

    Lets see why some performance profilers are fast while others are slow. All profilers, and performance profilers in particular, can be classified in yet another two categories:

    • event-based profilers (also called tracing profilers)
    • statistical profilers (also called sampling profilers)

    Event-based profilers collect data on events from a well-defined event set. Such event set may contain events for enter/leave function, object allocation, thrown exception and so on. Statistical profilers usually collect data/samples on regular intervals (e.g. take a sample on every 5 milliseconds).

    At first, it is not obvious whether event-based/tracing profilers are faster or slower than statistical/sampling ones. So, lets first have a look the the current OOP platforms. For the sake of simplicity we will have a look at the current .NET platform.

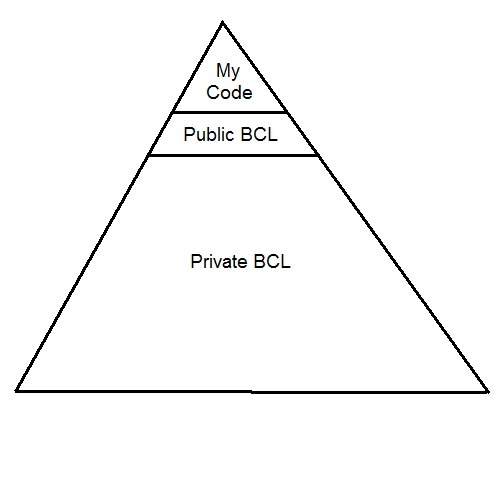
    Each .NET application makes use of the .NET Base Class Library (BCL). Because of current OOP design principles most frameworks/libraries have a small set of public interfaces and a fair amount of private encapsulated APIs. Lets look at the picture above. As you see your application can call only a small number of public BCL interfaces while they in turn can call much more richer APIs. So, you see only the “tip of the iceberg”. It is a common scenario when a single call to a public BCL interface results in a few dozen private interface calls.

    Lets have an application that runs for 10 seconds and examine the following two scenarios.

    Scenario 1

    The application makes heavy usage of “chatty” interface calls. It is easy to make 1000 method calls per second. In case of event-based/tracing performance profiler you have to process 20000 events (10000 enter function events + 10000 leave function events). In case of statistical/sampling performance profiler (assuming that the profiler collects data every 5 ms) your profiler have to process 2000 events. So, it is relatively safe to conclude that the tracing profiler will be slower than the sampling one. And this is the behavior that we most often see.

    Scenario 2

    Suppose your application is computation bound and performs a lot of loops and simple math operations. It is even possible that your “main” method calls a single BCL method (e.g. Console.WriteLine) only. In this case your event-based/tracing performance profiler have to process a few events only while the statistical/sampling performance profiler have to process 2000 events again. So, in this scenario is much safe to say that the tracing profiler will be faster than the sampling one.

    In reality, statistical/sampling profilers have constant 2-10% overhead. Event-based/tracing profilers often have 300-1000% overhead.

    Tracing or Sampling Profiler

    The rule of thumb is that you should start with a sampling profiler. If you cannot solve the performance issue then you should go for a tracing profiler. Tracing profilers usually collect much more data that helps to get better understanding about the performance issue.

    [Note: If you are not interested in the theoretical explanation you can skip the following two paragraphs.]

    If you’ve read carefully the last sentence then you’ve seen that I’ve made the implication that the more data the profiler has collected the easier you are going to solve the performance problem. Well, that’s not entirely true. You don’t really need data. As Richard Hamming said “The purpose of computing is insight, not numbers”. So, we don’t need data but rather “insight”. How do we define “insight” then? Well, the answer comes from relatively young information management and knowledge management. We define data, information, knowledge and wisdom as follows:

    • data: numbers/symbols
    • information: useful data that helps to answer “who”, “what”, “where” and “when” questions; information is usually processed data
    • knowledge: further processed information; it helps to answer “how” questions
    • wisdom: processed and understood knowledge; it helps to answer “why” questions

    So, it seems that we are looking for “information”. Here the algorithmic information theory comes to help. This theory is a mixture of Claude Shannon’s information theory and Alan Turing’s theory of computation. Andrey Kolmogorov and more recently Gregory Chaitin had defined quantitative measures of information. Though they followed different approaches an important consequence they made is that the output from any computation cannot contain more information than was the input in first place.

    Conclusion

    Drawing parallel back to profiling we now understand why sometimes we have to use event-based/tracing profilers. As always, everything comes at a price. Don’t be biased that profiling tools are slow. Use them and make your software better.

  • Preventing Stack Corruption

    I recently investigated stack corruption issue related to P/Invoke. In this post I am going to share my experience. I will show you a simple and yet effective approach to avoid similar problems.

    The Bug

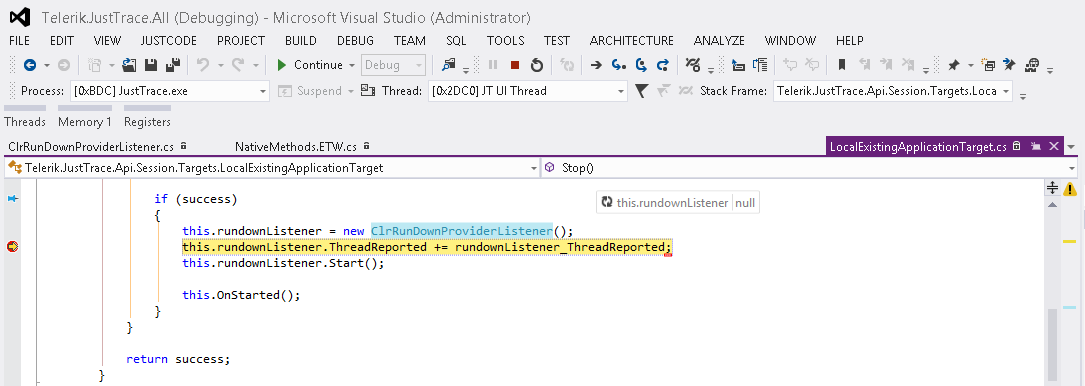
    A colleague of mine discovered the bug during debugging piece of code in JustTrace dealing with ETW. The issue was quite tricky because the bug manifested only in debug build by crashing the program. Considering that JustTrace requires administrator privileges I can only guess what could be the consequence of this bug when executed in release build. Take a look at code fragment shown on the following screen shot.

    The code is single threaded and looks quite straightforward. It instantiates an object and tries to use it. The constructor is executed without any exceptions. Still when you try to execute the next line the CLR throws an exception with the following message:

    Attempted to read or write protected memory. This is often an indication that other memory is corrupt.

    Solution 1: Managed Debugging Assistants

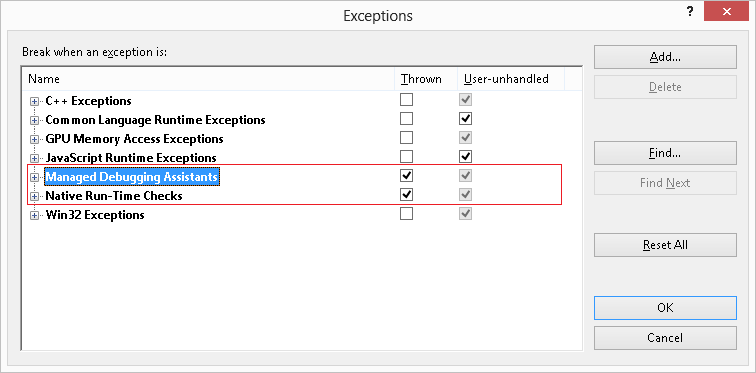
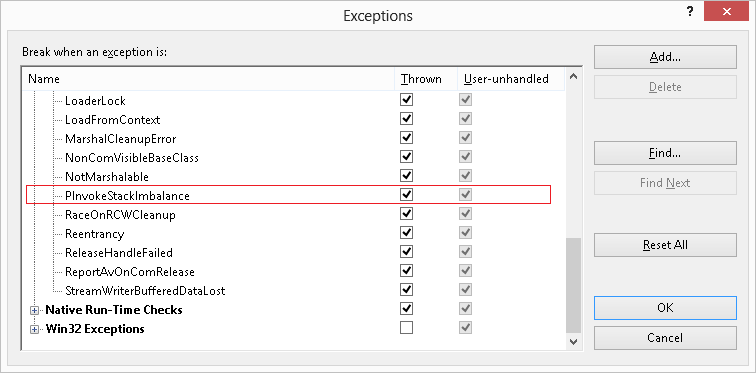
    I am usually pessimistic when it comes to MDA but I decided to give it a try. At first I tried MDA from within Visual Studio 2012.

    It didn’t work. Then I tried MDA from within windbg. Still no luck. In general my experience with MDA is not positive. It is very limited and works for simple scenarios (e.g. incorrect calling convention) only.

    Solution 2: Using Disassembly Window

    It does work. In case you are familiar with assembly language this is the easiest way to fix your program. In my case I was lucky and I had to debug a few hundred lines only. The reason was incorrect TRACE_GUID_REGISTRATION definition.

    internal struct TRACE_GUID_REGISTRATION
    {
       private IntPtr guid;
       // helper methods
    }

    This data structure was passed to RegisterTraceGuids function as in/out parameter and there was the stack corruption.

    The Fix

    A few things are wrong with TraceGuidRegistration definition. The first thing is that TraceGuidRegistration does not define the “handle” field. The second thing is that TraceGuidRegistration is not decorated with StructLayout attribute and this could be crucial. Here comes the correct definition.

    [StructLayout(LayoutKind.Sequential)]
    internal struct TRACE_GUID_REGISTRATION
    {
       private IntPtr guid;
       private IntPtr handle;
       // helper methods
    }

    Solution 3: FXCop – Using metadata to prevent the bug

    Once I fixed the code I started thinking how I can avoid such bugs. I came up with the idea to use FXCop tool which is part from Visual Studio 2010 and later. My intention was to decorate my data structure with a custom StructImport attribute like this:

    [StructImport("TRACE_GUID_REGISTRATION", "Advapi32.dll")]
    [StructLayout(LayoutKind.Sequential)]
    internal struct TraceGuidRegistration
    {
       private IntPtr guid;
       private IntPtr handle;
       // helper methods
    }

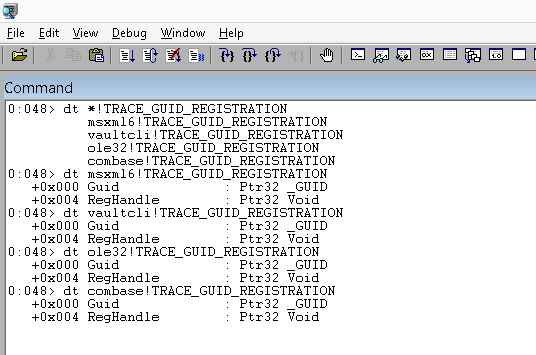
    To check whether it is possible I started JustTrace under windbg and loaded the symbols from Microsoft Symbol Server. I was surprised to see that there are four modules that export TRACE_GUID_REGISTRATION and none of them was advapi32.

    That’s OK. All I need is the information about TRACE_GUID_REGISTRATION layout. I quickly did a small prototype based on the DIA2Dump sample from DIA SDK (you can find it under <PROGRAM_FILES>\Microsoft Visual Studio 10.0\DIA SDK\Samples\DIA2Dump folder). I embedded the code into a custom FXCop rule and tested it. All works as expected.

    After a short break I observed that I could take another approach so I started refactoring my code.

    Solution 4: FXCop – Using convention to prevent the bug

    The previous solution works just fine. You apply the attribute on the data structures and the FXCop rule will validate if everything is OK. One of the benefits is that now you can name your data structures as you wish. For example you can name it TraceGuidRegistration instead of TRACE_GUID_REGISTRATION. However the two names are practically equal. Also, as I said I was surprised that TRACE_GUID_REGISTRATION is not defined in advapi32 module. As a matter of fact I don’t care where it is defined.

    So I decided to do my mappings in slightly different way. Instead of applying StructImport attribute I inspect the signature of all methods decorated with DllImport attribute. For example I can inspect the following method signature:

    [DllImport("AdvApi32", CharSet = CharSet.Auto, SetLastError = true)]
    static extern int RegisterTraceGuids(
        ControlCallback requestAddress,
        IntPtr requestContext,
        ref Guid controlGuid,
        int guidCount,
        ref TraceGuidRegistration traceGuidReg,
        string mofImagePath,
        string mofResourceName,
        out ulong registrationHandle);

    I know that the fifth parameter has type TraceGuidRegistration so I can try to map it. What is nice of this approach is that I can verify that both the TraceGuidRegistration layout is correct and that the StructLayout attribute is applied. And these were the two things that caused the stack corruption.

    Conclusion

    Once I refactored my FXCop rule to use convention instead of explicit attribute declaration I start wondering whether such FXCop rules could be provided by Microsoft. So far I don’t see obstacles for not doing so. The task is trivial for all well-known data structures provided by Windows OS. All needed is an internet connection to the Microsoft Symbol Server. I guess the StructImport solution could be applied for any custom data structure mappings. I hope in the future Visual Studio versions Microsoft will prove a solution for such kind of bugs.

  • CLR Profilers and Windows Store apps

    Last month Microsoft published a white paper about profiling Windows Store apps. The paper is very detailed and provides rich information how to build CLR profiler for Windows Store apps. I was very curious to read it because at the time when we released JustTrace Q3 2012 there was no documentation. After all, I was curious to know whether JustTrace is compliant with the guidelines Microsoft provided. It turns out it is. Almost.

    At time of writing JustTrace profiler uses a few Win32 functions that are not officially supported for Windows Store apps. The only reason for this is the support for Windows XP. Typical example is CreateEvent which is not supported for Windows Store apps but is supported since Windows XP. Rather one should use CreateEventEx which is supported since Windows Vista.

    One option is to drop the support for Windows XP. I am a bit reluctant though. At least such decision should be carefully thought and must be supported by actual data for our customers using Window XP. Another option is to accept the burden to develop and maintain two source code bases – one for Windows XP and another for Windows Vista and higher. Whatever decision we are going to make, it will be thoroughly thought out.

    Let’s have a look at the paper. There is one very interesting detail about memory profiling.

    The garbage collector and managed heap are not fundamentally different in a Windows Store app as compared to a desktop app.  However, there are some subtle differences that profiler authors need to be aware of.

    It continues even more interesting.

    When doing memory profiling, your Profiler DLL typically creates a separate thread from which to call ForceGC. This is nothing new.  But what might be surprising is that the act of doing a garbage collection inside a Windows Store app may transform your thread into a managed thread (for example, a Profiling API ThreadID will be created for that thread)

    Very subtle indeed. For a detailed explanation, you can read the paper. Fortunately JustTrace is not affected by this change.

    In conclusion, I think the paper is very good. It is a mandatory reading for anyone interested in building CLR profiler for Windows Store apps. I would encourage you to see CLR profiler implementation as well.

  • Profiling Tools and Standardization

    Imagine you have the following job. You have to deal with different performance and memory issues in .NET applications. You often get questions from your clients “Why my application is slow and/or consumes so much memory?” along with trace/dump files produced by profiling tools from different software vendors. Yeah, you guess it right – your job is a tough one. In order to open the trace/dump files you must have installed all the variety of profiling tools that your clients use. Sometimes you must have different versions of a particular profiling tool installed, a scenario that is rarely supported by the software vendors. Add on top of this the price and the different license conditions for each profiling tool and you will get an idea why your job is so hard.

    I wish I can sing “Those were the days, my friend” but I don’t think we have improved our profiling tools much today. The variety of trace/dump file formats is not justified. We need a standardization.

    Though I am a C++/C# developer, I have a good idea what is going on in the Java world. There is no such variety of trace/dump file formats. In case you are investigating memory issues you will probably have to deal with IBM’s portable heap dump (PHD) file format or Sun’s HPROF. There is a good reason for this though. The file format is provided by the JVM. The same approach is used in Mono. While this approach is far from perfect it has a very important impact on the software vendors. It forces them to build their tools with a standardization in mind.

    Let me give you a concrete example. I converted the memory dump file format of the .NET profiler I work on to be compatible with HPROF file format and then I used a popular Java profiler to open it. As you may easily guess, the profiler successfully analyzed the converted data. There were some caveats during the converting process, but it is a nice demonstration that with the proper level of abstraction we can build profiling tools for .NET and Java at the same time. If we can do this then why don’t we have a standardization for trace/dump files for .NET?

    In closing, I think all software vendors of .NET profiling tools will benefit from such standardization. The competition will be stronger which will lead to better products on the market. The end-users will benefit as well.

  • Enumerate managed processes

    If you ever needed to enumerate managed (.NET) processes you probably found that this is a difficult task. There is no single API that is robust and guarantees correct result. Let’s see what the available options are:

    You can take a look at the following examples:

    Unfortunately, each one of these approaches has a hidden trap. You cannot enumerate 64bit processes from a 32bit process and you cannot enumerate 32bit processes from a 64bit process. After all, it makes sense because most of these techniques rely on reading another process memory.

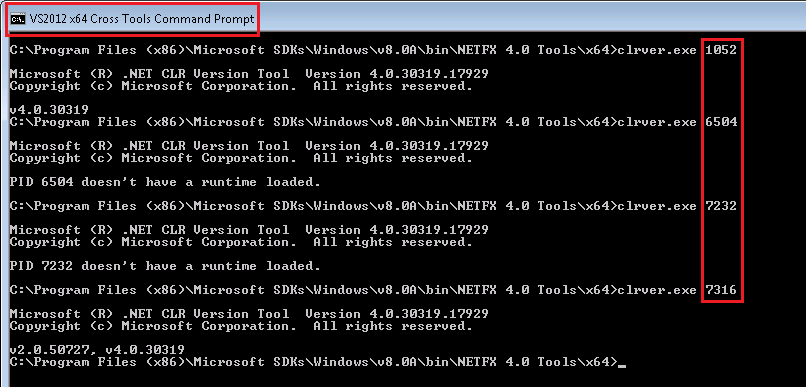
    This is a well-known issue. Microsoft has provided a tool called clrver.exe that suffers from the same problem. The following screen shots demonstrate it.

    As we can see the 32bit clrver.exe can enumerate 32bit processes only. If you try it on 64bit process you get the error “Failed getting running runtimes, error code 8007012b”. The same is valid for the 64bit scenario. The 64bit clrver.exe can enumerate 64bit processes only. If you try it on 32bit process you get “PID XXXX doesn’t have a runtime loaded”.

    A lot of people tried to solve this issue. The most common solution is to spawn a new process on 64bit Windows. If your process is 32bit then you have to spawn a 64bit process and vice versa. However, this is a really ugly “solution”. You have to deal with IPC and other things.

    However, there is a Microsoft tool that can enumerate both 32bit and 64bit managed processes. This is, of course, Visual Studio. In the Attach to Process dialog you can see the column “Type” that shows what CLR versions are loaded if any.

    I don’t know how Visual Studio does the trick so I implemented another solution. I am not very happy with the approach that I used, but it seems stable and fast. I also added support for Silverlight (see process 7232).

    You can find a sample source code at the end of the posting.

    EnumManagedProcesses.zip