Yesterday I watched the old movie Time Bandits. I would like to share a funny moment from the movie.
Here is the exact quote 🙂
Mihail's blog
Yesterday I watched the old movie Time Bandits. I would like to share a funny moment from the movie.
Here is the exact quote 🙂
In JustTrace Q1 2013 we added support for analyzing GC roots that are static fields. The implementation of this feature uses ICorProfilerInfo2::GetAppDomainStaticAddress, ICorProfilerInfo2::GetThreadStaticAddress and so on. Among all these methods, there is a very interesting one, namely ICorProfilerInfo2::GetRVAStaticAddress. In this post I am going to focus on a little known CLR feature that is closely related to this method.
What I find so interesting in ICorProfilerInfo2::GetRVAStaticAddress method is the RVA abbreviation. It stands for relative virtual address. Here is the definition from Microsoft PE and COFF Specification:
In an image file, the address of an item after it is loaded into memory, with the base address of the image file subtracted from it. The RVA of an item almost always differs from its position within the file on disk (file pointer).
Once we know what RVA is, we can make a few reasonable guesses about RVA static fields. Since RVA should be known at compile/link time, it is reasonable to guess that the static field should be a value type and should not contain any reference types. We can use the same argument so that any RVA field should be static since it does not make sense to have multiple instance fields occupying the same RVA.
Lets try find out whether our guesses are correct. Because VB.NET\C# can specify only application domain static and thread static fields we should look at Standard ECMA-335. We are interested in RVA static fields, so it makes sense to look at the field definition specification (II.16 Defining and referencing fields)
Field ::= .field FieldDecl
FieldDecl ::=
[ ‘[’ Int32 ‘]’ ] FieldAttr* Type Id [ ‘=’ FieldInit | at DataLabel ]
The interesting thing here is the at clause. This clause is used together with a DataLabel, so we have to find out what DataLabel is. Reading the document further we can see that II.16.3 Embedding data in a PE file paragraph starts with the following words:
There are several ways to declare a data field that is stored in a PE file. In all cases, the .data directive is used.
The good thing is that the document provides the following example code:
.data theInt = int32(123)
.data theBytes = int8 (3) [10]
After reading a little bit further we find the following text:
[…]In this case the data is laid out in the data area as usual and the static variable is assigned a particular RVA (i.e., offset from the start of the PE file) by using a data label with the field declaration (using the at syntax).
This mechanism, however, does not interact well with the CLI notion of an application domain (see Partition I). An application domain is intended to isolate two applications running in the same OS process from one another by guaranteeing that they have no shared data. Since the PE file is shared across the entire process, any data accessed via this mechanism is visible to all application domains in the process, thus violating the application domain isolation boundary.
Now, we know enough about RVA static fields so lets create a test scenario. I tried to keep it as simple as possible. I decided to create a console app that uses a class library, so I can replace the class library assembly with different implementation. Here is the source code for the console app:
using System;

namespace ConsoleApplication1
{
    class Program
    {
        static void Main(string[] args)
        {
            PrintStaticVar();

            AppDomain app = AppDomain.CreateDomain("MyDomain");
            app.DoCallBack(PrintStaticVar);

            AppDomain.Unload(app);
        }

        unsafe static void PrintStaticVar()
        {
            fixed (int* p = &ClassLibrary1.Class1.MyInt)
            {
                IntPtr ptr = new IntPtr(p);
                Console.WriteLine("app {0}, static {1:X}, addr {2:X}",
                                AppDomain.CurrentDomain.FriendlyName,
                                ClassLibrary1.Class1.MyInt,
                                ptr.ToInt64());
            }
        }
    }
}
As you can see, it prints the value and the address of MyInt static variable and it does so for the two application domains. Here is the source code for the class library:
using System;

namespace ClassLibrary1
{
    public class Class1
    {
        public static int MyInt = 0x11223344;
    }
}
The output from running the console app is as follows:
app ConsoleApplication1.exe, static 11223344, addr AF3C74
app MyDomain, static 11223344, addr E23EAC
Press any key to continue . . .
As you can see, the app prints unique address for each application domain. Now, it is time to provide different implementation for ClassLibrary1. This time we should write it in ILAsm:
.assembly extern mscorlib
{
  .publickeytoken = (B7 7A 5C 56 19 34 E0 89)
  .ver 4:0:0:0
}
.assembly ClassLibrary1
{
  .ver 1:0:0:0
}

.data MyInt_Data = int32(0x11223344)

.class public auto ansi ClassLibrary1.Class1
	extends [mscorlib]System.Object
{
  .field public static int32 MyInt at MyInt_Data
}
The last thing we have to do is to run the console app once again. Here is output:
app ConsoleApplication1.exe, static 11223344, addr 7A4000
app MyDomain, static 11223344, addr 7A4000
Press any key to continue . . .
As expected, this time the app prints the same address for both application domains. If you run the following command
dumpbin.exe /all ClassLibrary1.dll
and examine the output then you should see something similar
SECTION HEADER #2
  .sdata name
       4 virtual size
    4000 virtual address (00404000 to 00404003)
     200 size of raw data
     600 file pointer to raw data (00000600 to 000007FF)
       0 file pointer to relocation table
       0 file pointer to line numbers
       0 number of relocations
       0 number of line numbers
C0000040 flags
         Initialized Data
         Read Write

RAW DATA #2
  00404000: 44 33 22 11                                      D3".

  Summary

        2000 .sdata
We can see that the ILAsm compiler emitted MyInt_Data value in the .sdata section. Cross checking with ILDasm only assures us that FieldRVA table contains the correct RVA.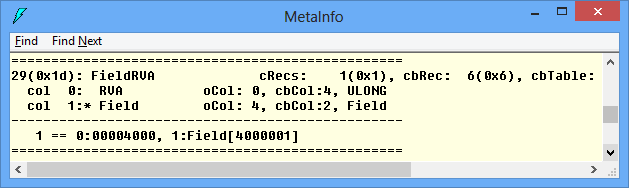
Lets check our guess that RVA static fields should be value type only. It is easy to modify our code by adding the following lines appropriately:
.data MyString_Data = char*("test")
//...
.field public static string MyString at MyString_Data
If you try to run the console app again you will get System.TypeLoadException.
In closing, I think RVA static fields are little known CLR feature because they aren’t very useful. It is good know that the CLR has this feature but I guess its practical usage is limited.
The last two weeks I was busy with the latest release of JustTrace. We had some hard times with JustTrace Q1 2013 release but after all we managed to fix a critical bug and we shipped SP1 after one week. There are a lot of new features in this release but I am going to focus on one thing only:
Visual Studio integration is out-of-process
If you use Visual Studio 2012 then you probably noticed a new process XDesProc.exe on your machine.

This is the new XAML UI Designer. Lets use Spy++ tool on the XAML designer in Visual Studio 2012 and see what’s interesting.

If you convert 0x1554 to decimal number you will get 5460 and that’s the XDesProc.exe process id shown on the screen shot above. So, what we see in Visual Studio is actually a window that belongs to XDesProc.exe process. Moving the XAML UI Designer out of Visual Studio has a lot of benefits – better isolation, improved performance and higher resource utilization. The same approach is used by Internet Explorer, Firefox and Chrome. You can read the full story about XDesProc.exe here.
So, why is it important to use out-of-process integration with Visual Studio? The short answer is more memory space. At present Visual Studio is 32bit process and this means that it can use at most 4GB (in most cases 2GB). This is a serious limitation for most profiling tools including JustTrace. For a long time, we wanted to move JustTrace out of Visual Studio and finally we did it. At the same time, JustTrace was built around the idea to provide seamless integration with Visual Studio. I am happy to say that the new JustTrace gives you the best of both worlds. Try it and give us your feedback.
There are a lot of articles explaining what technical dept is, so why another one? A lot of smart people has written about it (see the references at the end of the post). Despite of this, technical debt seems to be a hot topic over and over again and here I put my two cents in.
I like Eric Allman’s article Managing Technical Debt. My favorite quote from it is:
Technical debt is inevitable.
Some may find this statement a bit controversial. I had my own successes and failures in trying to manage the technical debt. My experience shows that one can avoid technical debt for small and simple projects only. However, nowadays we often work on large and complex projects. As a result we start our projects with insufficient understanding about them which in turn naturally leads to acquiring technical debt.
Lets define what technical debt is. Usually technical debt is defined as bad coding practices and “dirty hacks” that patch the software product instead of building it. Most of time the technical debt is attributed to lazy and/or inexperienced software developers. Often the reasons for acquiring technical debt are project specific but the most common are project cost, short deadlines, lack of experienced software engineers and so on.
A lot of managers and software developers are afraid of taking technical debt. I don’t think technical debt is a scary thing in case it is well-managed. The well-managed technical debt could save time and money. Today customers buy features, they are usually not interested in maintaining the source code. Shipping the right set of features on time can be a huge win for everyone.
It is all about the risks and managing technical debt. Unmanaged technical debt can be devastating. It tends to accumulate until you cannot pay it back. Every effort to maintain and/or extend the source code becomes harder. Eventually it slows the project and in the worst case the project is cancelled.
Sometimes acquiring technical debt cannot be observed or predicted. One can take technical debt intentionally or unintentionally. Unintentional technical debt could be dangerous if remains unnoticed for a long time. Intentional technical debt also can be dangerous if the risks taken are high. Martin Fowler provides a practical decision making approach when to take technical debt (see the references).
Common practices that help for better technical debt management are:
In closing, I think well-managed technical debt is a good thing. As every debt it allows you to do important things right now and pay the cost later. Consequences from bad technical debt are yet another reason to improve our skills in technical debt managements.
It is a common opinion that profiling tools are slow. Every time I stumble upon this statement I ask for the definition of slow. Most of the time I get the answer that a profiler is slow when it adds more than 100% overhead.
At present there many commercial profilers that are fast (according to the definition above). So, why don’t people use profiling tools then?
I think the confusion comes from the fact that there are different profiler types and some of them are fast while others are slow. Lets see what these profiler types are. It is common to classify profiling tools into two major categories:
Memory profilers are used when one wants to solve memory related issues like memory leaks, high memory consumption and so on. Performance profilers are used when one wants to solve performance related issues like high CPU usage or concurrency related problems. These categories are not set in stone though. For example too much memory allocation/consumption can cause performance issues.
Lets see why some performance profilers are fast while others are slow. All profilers, and performance profilers in particular, can be classified in yet another two categories:
Event-based profilers collect data on events from a well-defined event set. Such event set may contain events for enter/leave function, object allocation, thrown exception and so on. Statistical profilers usually collect data/samples on regular intervals (e.g. take a sample on every 5 milliseconds).
At first, it is not obvious whether event-based/tracing profilers are faster or slower than statistical/sampling ones. So, lets first have a look the the current OOP platforms. For the sake of simplicity we will have a look at the current .NET platform.

Each .NET application makes use of the .NET Base Class Library (BCL). Because of current OOP design principles most frameworks/libraries have a small set of public interfaces and a fair amount of private encapsulated APIs. Lets look at the picture above. As you see your application can call only a small number of public BCL interfaces while they in turn can call much more richer APIs. So, you see only the “tip of the iceberg”. It is a common scenario when a single call to a public BCL interface results in a few dozen private interface calls.
Lets have an application that runs for 10 seconds and examine the following two scenarios.
Scenario 1
The application makes heavy usage of “chatty” interface calls. It is easy to make 1000 method calls per second. In case of event-based/tracing performance profiler you have to process 20000 events (10000 enter function events + 10000 leave function events). In case of statistical/sampling performance profiler (assuming that the profiler collects data every 5 ms) your profiler have to process 2000 events. So, it is relatively safe to conclude that the tracing profiler will be slower than the sampling one. And this is the behavior that we most often see.
Scenario 2
Suppose your application is computation bound and performs a lot of loops and simple math operations. It is even possible that your “main” method calls a single BCL method (e.g. Console.WriteLine) only. In this case your event-based/tracing performance profiler have to process a few events only while the statistical/sampling performance profiler have to process 2000 events again. So, in this scenario is much safe to say that the tracing profiler will be faster than the sampling one.
In reality, statistical/sampling profilers have constant 2-10% overhead. Event-based/tracing profilers often have 300-1000% overhead.
Tracing or Sampling Profiler
The rule of thumb is that you should start with a sampling profiler. If you cannot solve the performance issue then you should go for a tracing profiler. Tracing profilers usually collect much more data that helps to get better understanding about the performance issue.
[Note: If you are not interested in the theoretical explanation you can skip the following two paragraphs.]
If you’ve read carefully the last sentence then you’ve seen that I’ve made the implication that the more data the profiler has collected the easier you are going to solve the performance problem. Well, that’s not entirely true. You don’t really need data. As Richard Hamming said “The purpose of computing is insight, not numbers”. So, we don’t need data but rather “insight”. How do we define “insight” then? Well, the answer comes from relatively young information management and knowledge management. We define data, information, knowledge and wisdom as follows:
So, it seems that we are looking for “information”. Here the algorithmic information theory comes to help. This theory is a mixture of Claude Shannon’s information theory and Alan Turing’s theory of computation. Andrey Kolmogorov and more recently Gregory Chaitin had defined quantitative measures of information. Though they followed different approaches an important consequence they made is that the output from any computation cannot contain more information than was the input in first place.
Conclusion
Drawing parallel back to profiling we now understand why sometimes we have to use event-based/tracing profilers. As always, everything comes at a price. Don’t be biased that profiling tools are slow. Use them and make your software better.
Have ever you noticed that people are obsessed by versioning the things? Yep, it’s true. Today, everything has a version. Even you. I am not sure why the versioning is so important. I guess it is related to the notion of improving the things.
Here is a short list of what I encounter most often in my job.
I can easily add a few dozen more items to the list. The things I selected can be classified as ideas, concepts, processes and standards. I won’t bother showing you software product versioning. However you may be surprised to see that versioning is applied to other things.
Versioning is applied even to food.
It’s not that we version the things around us only. We version ourself as well.
I am still playing with the idea of what would be the next version of me. Or you 😉
Bradley Braithwaite wrote an excellent blog post about the top 5 TDD mistakes. Check it out.
I recently investigated stack corruption issue related to P/Invoke. In this post I am going to share my experience. I will show you a simple and yet effective approach to avoid similar problems.
The Bug
A colleague of mine discovered the bug during debugging piece of code in JustTrace dealing with ETW. The issue was quite tricky because the bug manifested only in debug build by crashing the program. Considering that JustTrace requires administrator privileges I can only guess what could be the consequence of this bug when executed in release build. Take a look at code fragment shown on the following screen shot.

The code is single threaded and looks quite straightforward. It instantiates an object and tries to use it. The constructor is executed without any exceptions. Still when you try to execute the next line the CLR throws an exception with the following message:
Attempted to read or write protected memory. This is often an indication that other memory is corrupt.
Solution 1: Managed Debugging Assistants
I am usually pessimistic when it comes to MDA but I decided to give it a try. At first I tried MDA from within Visual Studio 2012.


It didn’t work. Then I tried MDA from within windbg. Still no luck. In general my experience with MDA is not positive. It is very limited and works for simple scenarios (e.g. incorrect calling convention) only.
Solution 2: Using Disassembly Window
It does work. In case you are familiar with assembly language this is the easiest way to fix your program. In my case I was lucky and I had to debug a few hundred lines only. The reason was incorrect TRACE_GUID_REGISTRATION definition.
internal struct TRACE_GUID_REGISTRATION
{
   private IntPtr guid;
   // helper methods
}
This data structure was passed to RegisterTraceGuids function as in/out parameter and there was the stack corruption.
The Fix
A few things are wrong with TraceGuidRegistration definition. The first thing is that TraceGuidRegistration does not define the “handle” field. The second thing is that TraceGuidRegistration is not decorated with StructLayout attribute and this could be crucial. Here comes the correct definition.
[StructLayout(LayoutKind.Sequential)]
internal struct TRACE_GUID_REGISTRATION
{
   private IntPtr guid;
   private IntPtr handle;
   // helper methods
}
Solution 3: FXCop – Using metadata to prevent the bug
Once I fixed the code I started thinking how I can avoid such bugs. I came up with the idea to use FXCop tool which is part from Visual Studio 2010 and later. My intention was to decorate my data structure with a custom StructImport attribute like this:
[StructImport("TRACE_GUID_REGISTRATION", "Advapi32.dll")]
[StructLayout(LayoutKind.Sequential)]
internal struct TraceGuidRegistration
{
   private IntPtr guid;
   private IntPtr handle;
   // helper methods
}
To check whether it is possible I started JustTrace under windbg and loaded the symbols from Microsoft Symbol Server. I was surprised to see that there are four modules that export TRACE_GUID_REGISTRATION and none of them was advapi32.

That’s OK. All I need is the information about TRACE_GUID_REGISTRATION layout. I quickly did a small prototype based on the DIA2Dump sample from DIA SDK (you can find it under <PROGRAM_FILES>\Microsoft Visual Studio 10.0\DIA SDK\Samples\DIA2Dump folder). I embedded the code into a custom FXCop rule and tested it. All works as expected.
After a short break I observed that I could take another approach so I started refactoring my code.
Solution 4: FXCop – Using convention to prevent the bug
The previous solution works just fine. You apply the attribute on the data structures and the FXCop rule will validate if everything is OK. One of the benefits is that now you can name your data structures as you wish. For example you can name it TraceGuidRegistration instead of TRACE_GUID_REGISTRATION. However the two names are practically equal. Also, as I said I was surprised that TRACE_GUID_REGISTRATION is not defined in advapi32 module. As a matter of fact I don’t care where it is defined.
So I decided to do my mappings in slightly different way. Instead of applying StructImport attribute I inspect the signature of all methods decorated with DllImport attribute. For example I can inspect the following method signature:
[DllImport("AdvApi32", CharSet = CharSet.Auto, SetLastError = true)]
static extern int RegisterTraceGuids(
    ControlCallback requestAddress,
    IntPtr requestContext,
    ref Guid controlGuid,
    int guidCount,
    ref TraceGuidRegistration traceGuidReg,
    string mofImagePath,
    string mofResourceName,
    out ulong registrationHandle);
I know that the fifth parameter has type TraceGuidRegistration so I can try to map it. What is nice of this approach is that I can verify that both the TraceGuidRegistration layout is correct and that the StructLayout attribute is applied. And these were the two things that caused the stack corruption.
Conclusion
Once I refactored my FXCop rule to use convention instead of explicit attribute declaration I start wondering whether such FXCop rules could be provided by Microsoft. So far I don’t see obstacles for not doing so. The task is trivial for all well-known data structures provided by Windows OS. All needed is an internet connection to the Microsoft Symbol Server. I guess the StructImport solution could be applied for any custom data structure mappings. I hope in the future Visual Studio versions Microsoft will prove a solution for such kind of bugs.
I guess this is one of those topics without beginning and end. You’ve probably already noticed that there is a shift in the education. The change affects mainly primary and secondary education, college education and undergraduate university education. In my opinion the latter is most affected. Many people perceive it as a decrease in the quality of the education. You’ve probably read such news in your local newspaper or mainstream media. There are reports, studies and no one seems to have clear idea on what to do about it.
I cannot speak about the education as a whole. I can share my thoughts about the undergraduate university education in IT and computer science though. My impressions come mainly from conducting job interviews for my team and from communication with students and interns. The conclusion is that today the education skips some theoretical foundations in favor of more practical knowledge and skills. For example I had 24 main classes during my graduation while today the typical IT/CS students have 32 main classes. The students just don’t have enough time to focus and dive deep into the things. The impact of this is that the current students have faster start as junior software engineers but they need more time to become more proficient.
While some people find the current education insufficient I think it is just different. The education focus has shifted because of the need in the IT industry. In my opinion the lack of the theoretical foundations can be easily compensated with today free online education. Many universities including MIT and Stanford offer free online courses. There is OpenCourseWare Consortium as well. For more advanced things and research one can use Directory of Open Access Journals. There are hundreds of free journals on various topics.
In conclusion, though the most of the existing IT/CS education programs are more focused on the practical knowledge and skills there are a lot of free online resources that can compensate the lack of theoretical foundations. It is up to the students and their will to improve.
Last month Microsoft published a white paper about profiling Windows Store apps. The paper is very detailed and provides rich information how to build CLR profiler for Windows Store apps. I was very curious to read it because at the time when we released JustTrace Q3 2012 there was no documentation. After all, I was curious to know whether JustTrace is compliant with the guidelines Microsoft provided. It turns out it is. Almost.
At time of writing JustTrace profiler uses a few Win32 functions that are not officially supported for Windows Store apps. The only reason for this is the support for Windows XP. Typical example is CreateEvent which is not supported for Windows Store apps but is supported since Windows XP. Rather one should use CreateEventEx which is supported since Windows Vista.
One option is to drop the support for Windows XP. I am a bit reluctant though. At least such decision should be carefully thought and must be supported by actual data for our customers using Window XP. Another option is to accept the burden to develop and maintain two source code bases – one for Windows XP and another for Windows Vista and higher. Whatever decision we are going to make, it will be thoroughly thought out.
Let’s have a look at the paper. There is one very interesting detail about memory profiling.
The garbage collector and managed heap are not fundamentally different in a Windows Store app as compared to a desktop app. However, there are some subtle differences that profiler authors need to be aware of.
It continues even more interesting.
When doing memory profiling, your Profiler DLL typically creates a separate thread from which to call ForceGC. This is nothing new. But what might be surprising is that the act of doing a garbage collection inside a Windows Store app may transform your thread into a managed thread (for example, a Profiling API ThreadID will be created for that thread)
Very subtle indeed. For a detailed explanation, you can read the paper. Fortunately JustTrace is not affected by this change.
In conclusion, I think the paper is very good. It is a mandatory reading for anyone interested in building CLR profiler for Windows Store apps. I would encourage you to see CLR profiler implementation as well.