If you are a .NET developer then you’ve probably heard or read about CLR metadata. In this blog post I will try to give you a pragmatic view of what CLR metadata is and how to work with it. You are going to learn how to use unmanaged metadata API from C# code. I will try to keep the blog post brief and clear, so I am going to skip some details where is possible. For more information, please refer to the links at the end.
A Simple Case Example
To make things real we will try to solve the following problem. Suppose we have the following interface definition in C#:
interface IFoo
{
    string Bar { get; }
    string Baz { set; }
}
Our goal is to get the property names (think of System.Reflection.PropertyInfo) with a pretty and fluent syntax in C#. For property Bar the task is trivial:
IFoo foo = null;
Expression<Func<string>> expr = () => foo.Bar;
var pi = (expr.Body as MemberExpression).Member as PropertyInfo;
In the case when the property has a getter we can leverage the power of C# compiler and use C# expression trees. The things for property Baz are more complicated. Usually, we end up something like this:
IFoo foo = null;
Action act = () => foo.Baz = "";
In this case the compiler emits a new type and the things get ugly because we have to decompile IL code in order to get the property name. As we are going to see, we will use the metadata API for a very simple form of decompilation.
Background
The term metadata refers to “data about data”.
— wikipedia
When it comes to CLR metadata the term metadata refers to what is known as descriptive metadata. I promised that I will be pragmatic, so let’s see a real example. I guess that you, as a .NET developer, know that Microsoft promotes .NET as a platform that solve the problem known as DLL hell. The main argument is that .NET provides a feature called Strong-Name Signing that assigns a unique identity to an assembly. Suppose we have two assemblies LibraryA.DLL and LibraryB.DLL and the former depends on the latter.

Suppose that during deployment we accidentally deploy LibraryB.DLL version 1.0.0.0 instead of version 2.5.0.0. The next time CLR tries to load the assembly LibraryA.DLL it will detect that we have deployed a wrong version of LibraryB.DLL and will fail with assembly load exception. Let’s see another scenario. You find and fix a bug in assembly LibraryB.DLL and replace the older file with the new one. Your existing assembly LibraryA.DLL continues to work as expected.
From these two scenarios, it is easy to guess that assembly LibraryA.DLL has enough information about LibraryB.DLL so that the CLR can spot the difference in case of improper deployment. This information comes from the CLR metadata. Assembly LibraryB.DLL has metadata that stores information about it (assembly name, assembly version, public types, etc.). When the compiler generates assembly LibraryA.DLL it stores in its metadata information about assembly LibraryB.DLL.
The CLR metadata is organized as a normalized relational database. This means that CLR metadata consists of rectangular tables with foreign keys between each other. In case you have previous experience with databases you should be familiar with this concept. Since .NET 2.0 there are more than 40 tables that define the CLR metadata. Here is a sample list of some of the tables:
- Module (0x00) – contains information about the current module
- TypeRef (0x01) – contains information about the types that are referenced from other modules
- TypeDef (0x02) – contains information about the types defined in the current module
- Field (0x04) – contains information about the fields defined in the current module
- Method (0x06) – contains information about the methods defined in the current module
- Property (0x17) – contains information about the properties defined in the current module
- Assembly (0x20) – contains information about the current assembly
- AssemblyRef (0x23) – contains information about the referenced assemblies
We can see that most of the information is organized around the current module. As we will see it soon, this organizational model is reflected in the metadata API. For now, it is important to say that an assembly has one or more modules. The same model is used in System.Reflection API as well. You can read more about it here.
Internally, the CLR metadata is organized in a very optimized format. Instead of using human readable table names it uses numbers (table identifiers, TIDs). In the table list above the numbers are shown in hexadecimal format. To understand the CLR metadata, we have to know another important concept – Record Index (RID). Let’s have a look at TypeDef table. Each row (record) in TypeDef table describes a type that is defined in the current module. The record indexes are continuously growing starting from 1. The tuple (TID, RID) is enough to unambiguously identify every metadata record in the current module. This tuple is called metadata token. In the current CLR implementation metadata tokens are 4 byte integers where the highest byte is TID and the rest 3 bytes are used for RID. For example, the metadata token 0x02000006 identifies the 6th record from TypeDef table.
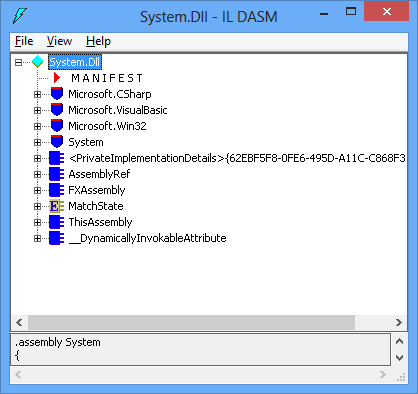
Let’s see the content of metadata tables. The easiest way is to use ILDASM tool. For the sake of this article I will load System.DLL assembly.

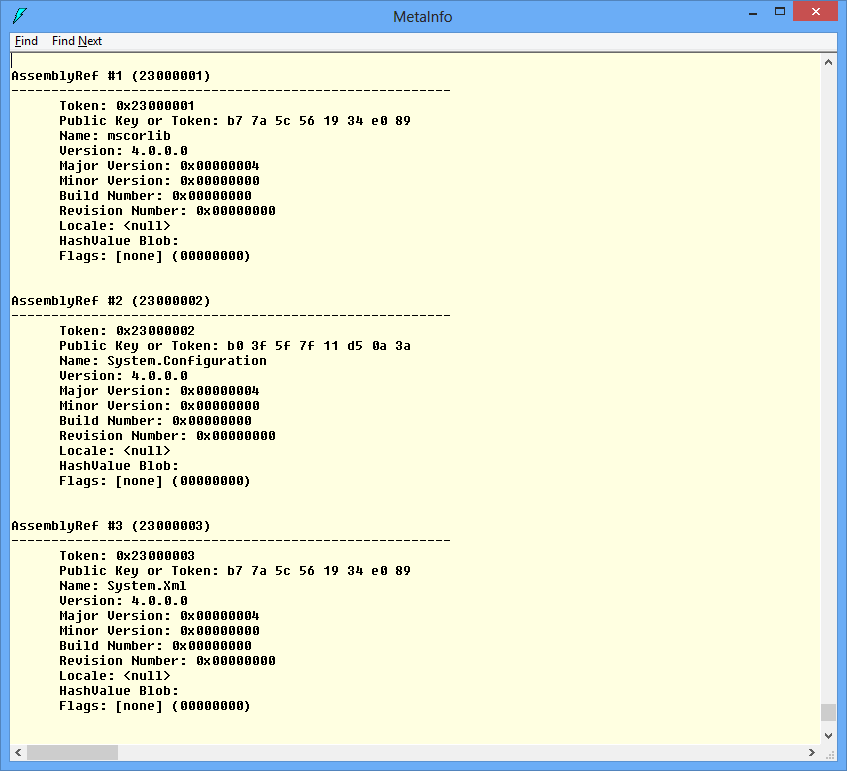
Once the assembly is loaded you can see the CLR metadata via View->MetaInfo->Show menu item (you can use CTRL+M shortcut as well). It takes some time to load all the metadata. Let’s first navigate to AssemblyRef (0x23) table.

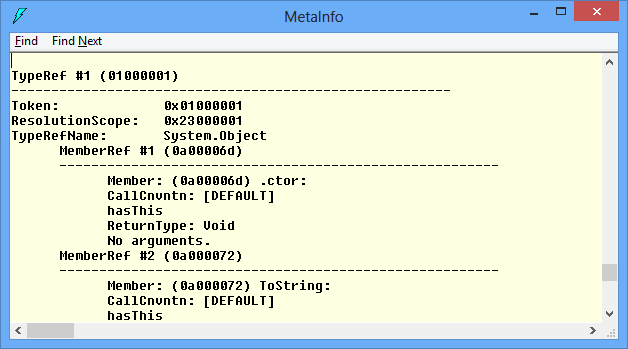
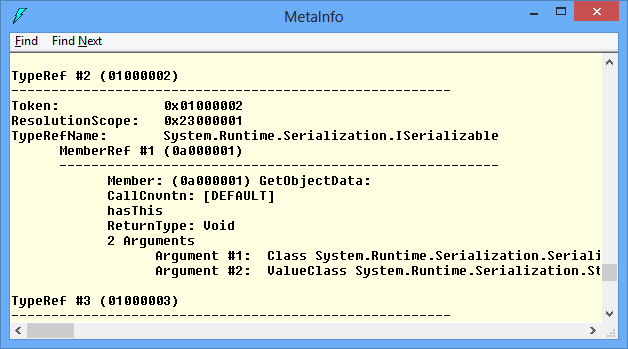
As we can see the assembly System.DLL refers to 3 other assemblies (mscorlib, System.Configuration and System.Xml). For each row (record), we can see what the actual column (Name, Version, Major, Minor, etc.) values are. Let’s have a look at TypeRef (0x01) table. The first record describes a reference to System.Object type from assembly with token 0x23000001, which is mscorlib (see the screenshot above). The next referred type is System.Runtime.Serialization.ISerializable and so on.


By now, I hope you understand at high level what CLR metadata is and how it is organized. There are a lot of tricky technical details about the actual implementation, but they are not important for the sake of this article. I encourage you to play with ILDASM and try the different views under View->MetaInfo menu. For more information, please refer to the links at the end.
Let’s write some code
Microsoft provides unmanaged (COM based) API to work with metadata. This API is used by debuggers, profilers, compilers, decompilers and other tools. First, we have to obtain an instance of CorMetaDataDispenser which implements IMetaDataDispenserEx interface. Probably, the easiest way is to use the following type definition:
[ComImport, GuidAttribute("E5CB7A31-7512-11D2-89CE-0080C792E5D8")]
class CorMetaDataDispenserExClass
{
}
//
var dispenser = new CorMetaDataDispenserExClass();
The value “E5CB7A31-7512-11D2-89CE-0080C792E5D8” passed to the GuidAttribute constructor is the string representation of the CLSID_CorMetaDataDispenser value defined in cor.h file from the Windows SDK. Another way to obtain an instance of the metadata dispenser is through Type/Activator collaboration:
Guid clsid = new Guid("E5CB7A31-7512-11D2-89CE-0080C792E5D8");
Type dispenserType = Type.GetTypeFromCLSID(clsid);
object dispenser = Activator.CreateInstance(dispenserType);
Either way, we cannot do much with the dispenser instance right now. As we said earlier, we need an instance of IMetaDataDispenserEx interface, so let’s cast it to IMetaDataDispenserEx interface:
var dispenserEx = dispenser as IMetaDataDispenserEx;
The CLR will do QueryInterface for us and return the right interface type. Let’s see IMetaDataDispenserEx definition:
[ComImport, GuidAttribute("31BCFCE2-DAFB-11D2-9F81-00C04F79A0A3"), InterfaceType(ComInterfaceType.InterfaceIsIUnknown)]
interface IMetaDataDispenserEx
{
    uint DefineScope(ref Guid rclsid, uint dwCreateFlags, ref Guid riid, out object ppIUnk);

    uint OpenScope(string szScope, uint dwOpenFlags, ref Guid riid, out object ppIUnk);

    uint OpenScopeOnMemory(IntPtr pData, uint cbData, uint dwOpenFlags, ref Guid riid, out object ppIUnk);

    uint SetOption(ref Guid optionid, object value);

    uint GetOption(ref Guid optionid, out object pvalue);

    uint OpenScopeOnITypeInfo(ITypeInfo pITI, uint dwOpenFlags, ref Guid riid, out object ppIUnk);

    uint GetCORSystemDirectory(char[] szBuffer, uint cchBuffer, out uint pchBuffer);

    uint FindAssembly(string szAppBase, string szPrivateBin, string szGlobalBin, string szAssemblyName, char[] szName, uint cchName, out uint pcName);

    uint FindAssemblyModule(string szAppBase, string szPrivateBin,string szGlobalBin, string szAssemblyName, string szModuleName, char[] szName, uint cchName, out uint pcName);
}
For the sake of readability, I removed all the marshaling hints that the CLR needs when doing the COM interop. Let’s see some of the details in this interface definition. The value “31BCFCE2-DAFB-11D2-9F81-00C04F79A0A3” is the string representation of IID_IMetaDataDispenserEx value defined in cor.h file from the Windows SDK. For the purpose of this article we are going to call the following method only:
uint OpenScope(string szScope, uint dwOpenFlags, ref Guid riid, out object ppIUnk);
Here goes the method description from the MSDN documentation:
- szScope – The name of the file to be opened. The file must contain common language runtime (CLR) metadata
- dwOpenFlags – A value of the CorOpenFlags enumeration to specify the mode (read, write, and so on) for opening
- riid – The IID of the desired metadata interface to be returned; the caller will use the interface to import (read) or emit (write) metadata. The value of riid must specify one of the “import” or “emit” interfaces. Valid values are IID_IMetaDataEmit, IID_IMetaDataImport, IID_IMetaDataAssemblyEmit, IID_IMetaDataAssemblyImport, IID_IMetaDataEmit2, or IID_IMetaDataImport2
- ppIUnk – The pointer to the returned interface
The most interesting parameter is the third one (riid). We have to pass the GUID of the interface we want to get. In our case this is IMetaDataImport interface (import interfaces are used to read metadata while emit interfaces are used to write metadata).
So, to obtain an instance of IMetaDataImport interface we have to find its GUID from cor.h file and call OpenScope method:
Guid metaDataImportGuid = new Guid("7DAC8207-D3AE-4c75-9B67-92801A497D44");
object rawScope = null;
var hr = dispenserEx.OpenScope("myAssembly.dll", 0, ref metaDataImportGuid, out rawScope);
var import = rawScope as IMetaDataImport;
Finally, we have an instance of IMetaDataImport interface. Because the interface has more than 60 methods I present here only the methods we are going to use:
[ComImport, GuidAttribute("7DAC8207-D3AE-4C75-9B67-92801A497D44"), InterfaceType(ComInterfaceType.InterfaceIsIUnknown)]
interface IMetaDataImport
{
    void CloseEnum(IntPtr hEnum);

    uint GetScopeProps(char[] szName, uint cchName, out uint pchName, ref Guid pmvid);

    uint GetTypeRefProps(uint tr, out uint ptkResolutionScope, char[] szName, uint cchName, out uint pchName);

    uint ResolveTypeRef(uint tr, ref Guid riid, out object ppIScope, out uint ptd);

    uint EnumMethods(ref IntPtr phEnum, uint cl, uint[] rMethods, uint cMax, out uint pcTokens);

    uint GetMethodProps(uint mb, out uint pClass, char[] szMethod, uint cchMethod, out uint pchMethod, out uint pdwAttr, out IntPtr ppvSigBlob, out uint pcbSigBlob, out uint pulCodeRVA, out uint pdwImplFlags);

    uint GetMemberRefProps(uint mr, out uint ptk, char[] szMember, uint cchMember, out uint pchMember, out IntPtr ppvSigBlob, out uint pbSigBlob);

    // for brevity, the rest of the methods are omitted
}
Probably the most interesting methods are GetMethodProps and GetMemberRefProps. The first method takes MethodDef token as a first parameter while the second method takes MemberRef token. As we know, MethodDef tokens are stored in Method (0x02) table and MemberRef tokens are stored in MemberRef (0x0a) table. The first ones describe methods defined in the current module while the second ones describe methods (and members) referenced from other modules.
At first sight there is not much difference between MethodDef and MemberRef tokens, but as we are going to see the difference is crucial. Let’s have a look at the following code fragment:
Expression<Func<bool>> expr = () => string.IsNullOrEmpty("");
MethodInfo mi = (expr.Body as MethodCallExpression).Method;
int methodDef = mi.MetadataToken;
The sole purpose of this code is to obtain the MethodDef token of IsNullOrEmpty method. At first it may not be obvious but MetadataToken property returns the MethodDef token of that method. On my machine the actual token value is 0x06000303. So, the table name is MethodDef (0x06) and the RID is 0x303. A quick check with ILDASM tool confirms it:

Let’s experiment and execute the following code fragment:
Type[] mscorlibTypes = typeof(string).Assembly.GetTypes();
var q = from type in mscorlibTypes
        from method in type.GetMethods()
        where method.MetadataToken == 0x06000303
        select method;

MethodInfo mi2 = q.SingleOrDefault();
// "same" is true
bool same = object.ReferenceEquals(mi, mi2);
So, our strategy is to get the MethodDef token of the property setter and then run a LINQ query similar to the one shown above. In reality the code is more complex:
private static MethodInfo GetMethodInfoFromScope(uint token, Assembly assemblyScope, Guid mvid)
{
    MethodInfo mi = null;

    if ((token != mdTokenNil) && (assemblyScope != null) && (mvid != Guid.Empty))
    {
        const BindingFlags flags = BindingFlags.Static | BindingFlags.Instance | BindingFlags.Public | BindingFlags.NonPublic;

        var q = from module in assemblyScope.Modules
                from type in module.GetTypes()
                from method in type.GetMethods(flags)
                where (method.MetadataToken == token)
                       && (method.Module.ModuleVersionId == mvid)
                select method;

        mi = q.SingleOrDefault();
    }

    return mi;
}
Because tokens are unique inside a module only, we have to iterate over all assembly modules and find the right one. Fortunately, each module has version id (module version ID, MVID) which is a unique GUID generated during compilation. For example, the module CommonLanguageRuntimeLibrary from mscorlib assembly installed on my machine has the following MVID “AD977517-F6DA-4BDA-BEEA-FFC184D5CD3F”.

We can obtain MVID via GetScopeProps method from IMetaDataImport interface.
So far we saw how to get a MethodInfo object for any method (including property setters) if we know the MethodDef token and the MVID of the containing module. However, we still don’t know how to proceed in case of MemberRef token. The solution is to find the original MethodDef token.
Here is the high level algorithm we have to follow:
- Call GetMemberRefProps to get the method name and the TypeRef token of the containing type (this is the second method parameter ptk)
- If TypeRef is a nested type, call GetTypeRefProps as many times as needed to get the most outer TypeRef
- Call ResolveTypeRef to get IMetaDataImport interface for the module that contains the corresponding TypeDef token
- Call EnumMethods for the TypeDef token from previous step
- For each MethodDef from previous step, call GetMethodProps to get its name, compare it with the name from step 1 and if they match return the current MethodDef token
This algorithm can be used for any method MemberRef, not just property setters. The only potential pitfall is the string comparison in the last step. As you know, the CLR supports method overloading. Fortunately, the current .NET compilers with property support don’t allow property overloading. Even if that was the case, we can use some of the flags returned by GetMemberRefProps for unambiguous method resolution.
Here is a high level skeleton of the algorithm:
uint methodRef = 0;
IMetaDataImport import = null;

uint typeRef;
uint memberRefNameLen = 0;
uint memberRefSigLen;
var memberRefName = new char[1024];
IntPtr ptrMemberRefSig;
var hr = import.GetMemberRefProps(methodRef, out typeRef, memberRefName, (uint)memberRefName.Length, out memberRefNameLen, out ptrMemberRefSig, out memberRefSigLen);

var name = new string(memberRefName, 0, (int)memberRefNameLen - 1);

uint resScope;
uint parentNameLen;
hr = import.GetTypeRefProps(typeRef, out resScope, null, 0, out parentNameLen);

uint typeDef = mdTokenNil;
object newRawScope = null;
Guid metaDataImportGuid = new Guid(IID_IMetaDataImport);
hr = import.ResolveTypeRef(typeRef, ref metaDataImportGuid, out newRawScope, out typeDef);

var newImport = newRawScope as IMetaDataImport;

var hEnum = IntPtr.Zero;
var methodTokens = new uint[1024];
var methodName = new char[1024];
uint len;
hr = newImport.EnumMethods(ref hEnum, typeDef, methodTokens, (uint)methodTokens.Length, out len);

for (var i = 0; i < len; i++)
{
    uint tmpTypeDef;
    uint attrs;
    var sig = IntPtr.Zero;
    uint sigLen;
    uint rva;
    uint flags;
    uint methodNameLen;
    hr = newImport.GetMethodProps(methodTokens[i], out tmpTypeDef, methodName, (uint)methodName.Length, out methodNameLen, out attrs, out sig, out sigLen, out rva, out flags);

    var curName = new string(methodName, 0, (int)methodNameLen - 1);

    if (name == curName)
    {
        // found methodDef
        break;
    }
}
The actual implementation is more complex. There are two tricky details:
- TypeRef resolution from step 2, in case TypeRef token is a token of a nested type
- The assemblyScope parameter in GetMethodInfoFromScope method
To solve the first issue we can simply use a stack data structure. We push all TypeRef tokens from GetTypeRefProps method. Then we pop the tokens and resolve them with ResolveTypeRef method. The second issue may not be obvious. We have to pass an assembly instance to GetMethodInfoFromScope method. However the metadata API does not require the CLR loader to load the assembly (in an AppDomain). In a matter of fact the metadata API does not require CLR to be loaded at all. So we have to take care and load the assembly if needed:
newAssembly = AppDomain.CurrentDomain.GetAssemblies().FirstOrDefault(a => a.GetName().FullName.Equals(asmName.FullName));
if (newAssembly == null)
{
    newAssembly = Assembly.Load(asmName);
}
// pass newAssembly to GetMethodInfoFromScope(...) method
So far, we worked mostly with modules but right now we have to find an assembly by name. This means that we have to obtain the assembly name from the current module. For this purpose we are going to use IMetaDataAssemblyImport interface. This interface has more than a dozen methods, but for the sake of this article we are going to use two methods only:
[ComImport, GuidAttribute("EE62470B-E94B-424E-9B7C-2F00C9249F93"), InterfaceType(ComInterfaceType.InterfaceIsIUnknown)]
interface IMetaDataAssemblyImport
{
    uint GetAssemblyFromScope(out uint ptkAssembly);

    uint GetAssemblyProps(uint mda,
                            out IntPtr ppbPublicKey,
                            out uint pcbPublicKey,
                            out uint pulHashAlgId,
                            char[] szName,
                            uint cchName,
                            out uint pchName,
                            out ASSEMBLYMETADATA pMetaData,
                            out uint pdwAssemblyFlags);

    // for brevity, the rest of the methods are omitted
}
To obtain an instance of IMetaDataAssemblyImport interface we have to cast it from existing an instance of IMetaDataImport interface:
var asmImport = import as IMetaDataAssemblyImport;
Again, the CLR will do QueryInterface for us and return the proper interface. Once we have an instance of IMetaDataAssemblyImport interface we use it as follows:
- Call GetAssemblyFromScope to obtain the current assemblyId
- Call GetAssemblyProps with the assemblyId from the previous step
Until now, we saw how to use the metadata API from C#. One question left unanswered though. How can we get MethodDef or MemberRef token? At the beginning we started with a simple delegate, so we can use it to get the byte array of IL instructions that represent the method body:
Action act = () => foo.Baz = "";
byte[] il = act.Method.GetMethodBody().GetILAsByteArray();
It is important to recall that our goal is to decompile the method body of the method pointed by this delegate. This method has a few instructions, it simply calls the property setter with some value. We are not going to do any kind of control flow analysis. All we are going to do is to find the last method invocation (in our case the property setter) inside the method body.
Almost every method call in the CLR is done through call or callvirt instruction. Both instructions take a method token as a single parameter. All we have to do is parse the IL byte array for call or callvirt instruction and interpret the next 4 bytes as a method token. We then check whether the token is MethodDef or MemberRef and if this is the case we pass it to the metadata API.
I hope this article gave you an idea what metadata API is and how to use it from C#. I tried to focus on the interfaces needed for solving our specific scenario. The metadata API has much more functionality than what we saw here. It allows you to emit new methods, new types and new assemblies as well.
Source Code
 MetadataDemo.zip
References

