Mobile Application Development

Mobile application development is more popular than ever. Today, there are tens of mobile application development platforms (MADPs) that fight for adoption and market share. In this post, I am going to share what characteristics a good, in my opinion, MADP should have.

Let’s start with some facts and obvious trends. Today, most of us have a mobile device of some sort and the trend is that mobile devices would become even more popular. So, it is a growing market with a lot of opportunities. To stay competitive on the market, you must have shorter product release cycles while maintaining excellent product quality. Using a MADP is one way to achieve the aforementioned goals.

So, you have this wonderful idea for a mobile application and you want it to be a big success. First, you have to build it. Let’s dig in the build process. Many applications start their live as a series of visual concepts. Usually the app author has mind models for some user interfaces (UIs), e.g. some buttons, labels, text boxes, etc. and some logic behind these UIs. A good MADP should reflect this thought process and should provide model-view-controller (MVC) paradigm for app development. Good news is that today’s modern MADPs support MVC design pattern. It should be mentioned that a MADP should support both declarative and imperative ways to define a UI. Another important aspect of the declarative UI programming is that the declarative language should be both easy and powerful. Nobody demands that all MADPs should use the same UI declarative language but it should be easy for us mere developers to switch between different MADPs when it does make sense.

We touched an important part of the application development – the programming language. A good MADP should use as common as possible programming language (in an ideal world MADP should support multiple programming languages). There is no point to have superb MADPs that use uncanny or esoteric languages. The entering barrier should be as low as possible. Using well-know and popular languages has a lot of benefits. Your developers can be easily trained in case they are not experienced with it. Another advantage is that there will be a lot of frameworks, components and libraries for that language. The presence of package manager like NuGet, npm or gem is also a big advantage. Community driven package repositories are invaluable and a big time saver. Of course, sometimes a MADP may offer new possibilities at the cost of a new or unpopular programming language and in this case I would recommend to carefully reconsider all the risks.

A closely related topic to the programming language is the IDE. For some developers it is a bit controversial topic but there are many others that find using an IDE a good practice. In general, a good MADP should not tie you up to a particular IDE and should allow building applications without an IDE as well. But for many developers the presence of an IDE is reassuring. Providing features as auto-completion, visual debugging, navigation and code refactoring may increase developer productivity. An IDE can also provide visual designers to support MVC design pattern as well.

While we examined the programming language and its surrounding ecosystem, our main focus was on the usage of local frameworks, components and libraries. We haven’t look at cloud services though. A good MADP should offer the following minimal set of cloud services: data services for storing application data, authentication services for managing user and application identities, push notification services for notifying mobile application about important events, integration data services for integrating and sharing data with other applications and custom application services for building common application logic blocks.

So far, we talked a lot about source code. Ultimately, this source code must be stored somewhere. In some cases, before you start with the project you already have the source code for some of components in your repository. A good MADP should support external source code repositories and support the most common source control systems (e.g. git, svn, mercurial, etc). This is an important requirement as we will read about testing and deploying in the next paragraphs.

We covered the major part of the building mobile application. This is only a part from build-test-deploy cycle though. While most developers are aware of the benefits of continuous integration (CI) solutions and embrace test-drive development (TDD) practices, they often underestimate the last part of build-test-deploy cycle. I am going to explore the last two parts together as the test part should test the deployment as well. Often, there is a friction in deployment process that forces the developers to test their app on a few platforms only. The problem is that the variety of mobile devices is enormous and there are good chances that your app won’t work correctly on some devices. Instead of testing and deploying your app on five or ten devices you should better test it on dozens of devices. A good MADP will automate as much as possible starting with CI, automated unit testing, deployment and automated UI/integration testing. A MADP should provide intelligent test scenarios for different mobile platforms and operating systems.

Okay, we have built and released our application, now what? Now comes another important thing – collecting and analyzing user feedback. My experience shows it is rarely that an app becomes success since its first release. Usually this is not the case. You release the first version and then start gathering user feedback what they like and dislike, what they want to see in next app versions and so on. Analyzing the user feedback is a hard task. There will be always users that likes your app and other that dislike it. It is a tricky thing what you should implement, change or improve in the next app version. To be able to take the right decision you should be correctly informed. This means that you should be able to collect and measure the user feedback. Once you have the data you can analyze it and take the proper actions. In my opinion, the hardest part is to engage the users to send you a feedback about their experience. A MADP should provide means that allow you to collect user experience data with minimal intrusion. Survey dialogs and rating forms just don’t work. A MADP should provide instruments to infer user experience from the application usage. There is a technical aspect as well. Collecting crash reports, call stacks and performance data from your app in also very important. Nobody likes unstable or slow apps. A MADP should provide mechanisms for collecting crash, bug and performance reports without any trouble for the end user.

In conclusion, a good MADP should:

  • support MVC design pattern
  • provide both declarative and imperative UI programming
  • use popular and well-know programming language
  • provide package manager
  • provide an optional IDE
  • provide rich cloud services
  • support as many as possible external source control systems
  • automate as much as possible and remove the friction in build-test-deploy cycle
  • collect and analyze user feedback and technical reports

Some of the existing MADPs claim they already provide these capabilities. Check it out yourself.

Distributed System Validation

Last week I read an article about Netflix Chaos Monkey and it provoked some thoughts. I’ve read about Chaos Monkey before but back then I didn’t realize some aspects of it. I guess the difference is that I recently started working on a distributed system project and an important aspect of my work is the validation of what we are doing.

So, how do we validate a distributed system? There is no need to reinvent the wheel so I googled around. That’s how I ended up reading Netflix article again. The idea is simple – terminate running “instances” and then watch how your distributed system changes. There are more details to it but the essence is that Chaos Monkey stops some of your instances/services (and makes them unavailable) so you can inspect how well your distributed system works in such scenarios. Please note that this approach works so well that Chaos Monkey runs on both test and production systems and it is considered as a key component for any major distributed system.

Let’s dig in further. Distributed systems, in fact all large projects, are built from many moving parts. Often, it is practically impossible to anticipate every possible problem that may occur in your system. Instead of waiting for problems you can happen them in a controlled manner and get feedback. This makes your system more resilient.

This gets me thinking about the way we build large projects and distributed systems in particular. Nowadays agile methodologies are widely accepted and we build software in small iterations. The continuous project evolution makes it hard doing correct reasoning and it is practically impossible to validate ever-changing system. Often, we build distributed system much like the way we play with Lego. We pick this web server, that database server, that network load balancer and so on, glue them together and add our services on top of it. During this process we rarely consider each component specifics and limitations. This (development) process leads to heisenbugs and other hard to reproduce issues.

Solutions like Chaos Monkey make it easier as they provide a process that helps the validation of your systems. Incorporating such process/methodology into your software development process gives you better monitoring and better guarantees for more resilient systems.

Profiing Data Visualization

Every .NET performance profiling tool offers some form of data visualization. Usually, the profiling data is shown in a hierarchical representation such as calling context tree (CCT) or calling context ring chart (CCRC). In this post I would like to provide a short description of the most commonly used profiling data visualizations.

In general, CCT is well understood. Software developers find CCT easy to work with as it represents the program workflow. For example, if method A() calls method B() which in turn calls method C() then the CCT will represent this program workflow as follows:

A() -> B() -> C()

CCT data contains the time that is spent inside each method (not shown here for the sake of simplicity). Here is a short list of some .NET profilers that use CCT/CCRC to visualize data:

While CCT is useful and easy to understand data visualization it has limitations. Often we create big applications with complex program workflows. For such big applications the CCT navigation becomes harder. Often the CCT size becomes overwhelming and the developers cannot grasp the data. To understand big CCT the profiling tools offer some form of aggregation. The most common aggregation is so called Hot Spot tree (HST). Sometimes it is called caller context tree but for the purpose of this post we will use former name. Here is the HST for our previous example:

C() <- B() <- A()

We said that HST is a form of aggregation but we didn’t explain what and how we aggregate. HST aggregates CCT nodes by summing the time spent inside a method for each unique call path. Let’s make it more concrete with a simple example. Suppose we have an application with the following program workflow (CCT):

A() -> B() -> C(/* 4s */)
           |
           |--> D() -> C(/* 6s */)

The time spent in method C() is 4 seconds when it is called from B() and the time spent in method C() is 6 seconds when it is called from D(). So, the total time spent in method C() is 10 seconds. We can build HST for method C() by aggregating the time for each unique call path.

C(/* 10s */) <- B(/* 4s */) <- A(/* 4s */)
              |
              |-- D(/* 6s */) <- B(/* 6s */) <- A(/* 6s */)

HST shows how the time spent in method C() is distributed for each unique call path. If we build HST for every method it becomes obvious why HST is so useful data visualization. Instead of focusing on the whole CCT which may contain millions of nodes we can focus on the top, say, 10 most expensive HSTs as they show us the top 10 most time expensive methods. In fact, I find HST so useful that I can argue that showing CCT is not needed at all when solving difficult performance issues.

I would like to address the last sentence as it is related to the DIKW pyramid. While CCT is useful profiling data visualization, it is mostly about data. Data is just numbers/symbols. It cannot answer “who”, “what”, “where” and “when” questions. Processing CCT into HSTs transforms data into information. HSTs can answer where time is spent inside an application. I am not going to address all the theoretical details here but I would like to dig some details about performance profiling further.

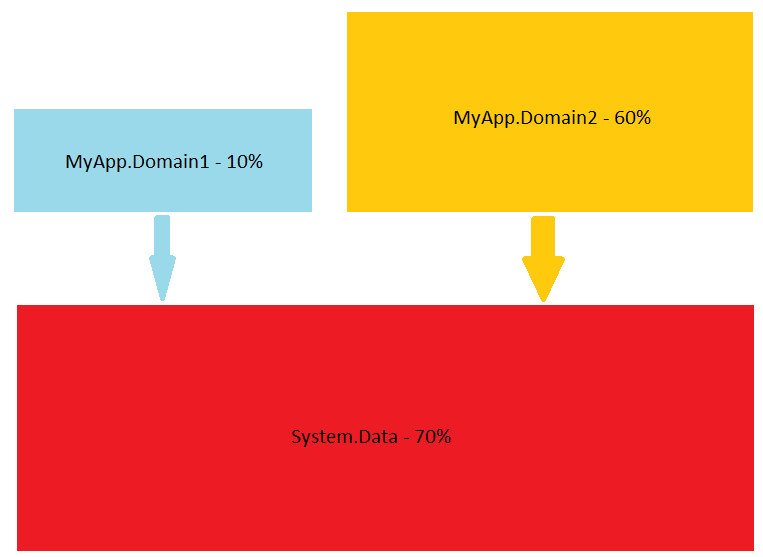
We saw why HSTs are useful but sometimes we want to know more. For example, is our application CPU or I/O bound? Or maybe we are interested in the application dynamics (e.g. when it is CPU bound and when it is I/O bound). Component interaction is also an important question for many of us. The software vendors of profiling tools recognize these needs and try to build better products. For example Microsoft provides Tier Interaction Profiling, Telerik JustTrace provides Namespace grouping, JetBrains dotTrace provides Subsystems, SpeedTrace offers Layer Breakdown and so on. While all these visualizations are useful, sometimes a simple diagram works even better.
Layers
The point is that there is no silver bullet. A single profiling data visualization cannot answer every question. I think ideas like Profiling Query Language (PQL) have a lot of potential. It doesn’t matter if there will be PQL or LINQ to some well established domain model (e.g. LINQ to Profiling Data). The language is only a detail. The important thing is that the collected data should be queryable. Once the data is queryable the developer can do the proper queries. Of course, each profiling tool can be shipped with a set of predefined common queries. I hope we will see PQL in action very soon 😉


CLR Limitations

Yesterday I ran one of my apps onto VirtualBox VM and it suddenly crashed with OutOfMemoryException. There is nothing special about my app, it allocates one large array of System.UInt64 and does some calculations. So, it seems that my problem was related to the array size.

Array size limitations

Here are a few facts about my app:

  • it allocates a single ~6GB array and it does memory intensive calculation
  • it uses the new .NET 4.5 configuration gcAllowVeryLargeObjects setting
  • it is compiled with “Any CPU” platform target (“Prefer 32-bit” option is not set)

My first thought was that the guest OS does not support 64-bit programs and I should compile my app with “x64” platform target support to make this requirement explicit. It turned out that this is not the case and the guest OS is Windows 7 Ultimate x64 edition. This is where I got confused. I decided to run my app onto the host OS and it ran as expected.

Let’s recap it. My host OS is Windows 7 Ultimate x64 Edition (same as the guest OS) and my app works. On the guest OS my app crashes The .NET version is 4.0.30319.18051 for both host OS and guest OS. The only difference is that the host OS has 16GB physical memory while the guest OS has 4GB. However, my understanding is that the amount of physical memory should not cause OutOfMemoryException.

The first thing I did was reading MSDN documentation one more time. There isn’t much related to my issue. The only relevant part is the following:

Using this element in your application configuration file enables arrays that are larger than 2 GB in size, but does not change other limits on object size or array size:

  • The maximum number of elements in an array is UInt32.MaxValue.
  • The maximum index in any single dimension is 2,147,483,591 (0x7FFFFFC7) for byte arrays and arrays of single-byte structures, and 2,146,435,071 (0X7FEFFFFF) for other types.
  • The maximum size for strings and other non-array objects is unchanged.

I decided to create a small repro app that isolates the problem:

static void Main(string[] args)
{
    var arr = new object[0X7FEFFFFF];
    Console.WriteLine(arr.LongLength);
    Console.ReadLine();
}

(I also modified app.config file accordingly)

<configuration>
  <runtime>
    <gcAllowVeryLargeObjects enabled="true" />
  </runtime>
</configuration>

When I run this program on the host OS it works as expected. When I run the same binary onto the VM I get OutOfMemoryException. I googled and found the following comment on stackoverflow since Sep 7 2010. This pretty much confirms my understanding stated above. Still, the reality is that this simple app crashes on the guest OS. Clearly, there is an undocumented (please correct me if I am wrong) CLR limitation.

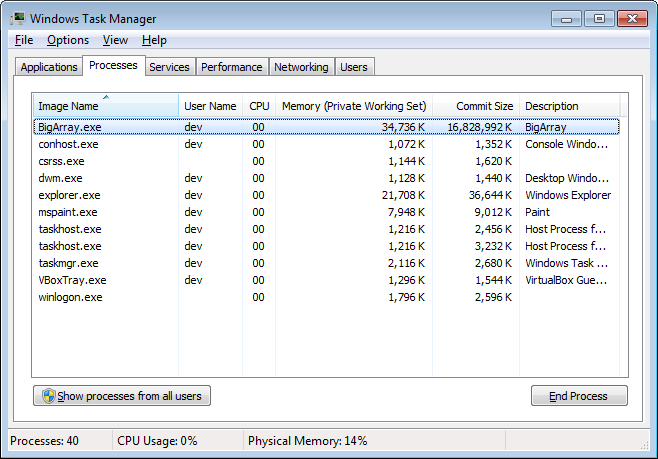
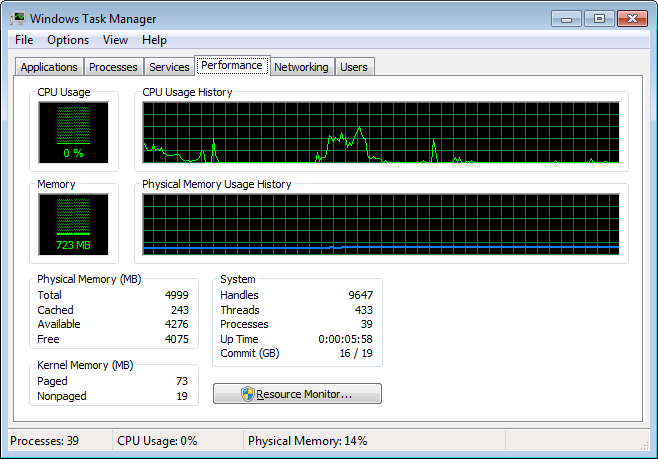
As I said before, the only difference between the host OS and the guest OS is the amount of the physical memory. So, I decided to increase the guest OS memory. I had no clear idea what I am doing and I set the memory to 5000MB (just some number larger then 4GB). This time, my app worked as expected.

memory
memory2

So, it seems that the physical memory is an important factor. I still don’t understand it and if you know why this happens please drop a comment. I guess the CLR team has good reason for that 4GB threshold but it would be nice if this is properly documented.

Object size limitations

Once I figured out that the physical memory can also limit the array size, I became curious what are the CLR limitations for regular objects. I quickly managed to find out that the maximum object size in my version of .NET is 128MB.

class ClassA
{
    public StructA a;
}

unsafe struct StructA
{
    public fixed byte data[128 * 1024 * 1024 - 8];
}

I can instantiate objects from ClassA without problems. However when I try add one more field (e.g. byte or bool) to ClassA or StructA definition I get the following error:

System.TypeLoadException was unhandled
Message: Size of field of type 'ClassA' from assembly
'Test, Version=1.0.0.0, Culture=neutral, PublicKeyToken=null'
is too large.

So, it seems that for my particular .NET version the maximum object size is 128MB. What about if we try to instantiate the following array:

var arr = new StructA[1];

In this case I get the following error:

System.TypeLoadException was unhandled
Message: Array of type 'StructA' from assembly
'Test, Version=1.0.0.0, Culture=neutral, PublicKeyToken=null' 
cannot be created because base value type is too large.

It turns out arrays have yet another limitation. In order to instantiate an array of StructA I have to modify StructA definition to the following:

unsafe struct StructA
{
    public fixed byte data[64 * 1024 - 4];
}

It seems that the maximum array base element size is limited to 64KB.

Conclusion

In closing, I would say it is always useful to know the CLR limitations. Sometimes they are manifested in an unexpected way but in the most common scenarios it is unlikely that you hit some of them.

OWIN and NGINX

Since a few months I work with non-Microsoft technologies and operating systems. I work with Linux, Puppet, Docker (lightweight Linux containers), Apache, Nginx, Node.js and other. So far, it is fun and I’ve learned a lot. This week I saw a lot of news and buzz around OWIN and Katana project. It seems that OWIN is a hot topic and I decided to give it a try. In this post I will show you how to build OWIN implementation and use Nginx server.

Note: this is proof of concept rather than a production-ready code.

OWIN is a specification that defines a standard interface between .NET web servers and web applications. Its goal is to provide a simple and decoupled way how web frameworks and web servers interact. As the specification states, there is no assembly called OWIN.dll or similar. It is just a way how you can build web applications without dependency on particular web server. Concrete implementations can provide OWIN.dll assembly though.

This is in a contrast with the traditional ASP.NET applications that have a dependency on System.Web.dll assembly. If implemented correctly OWIN eliminates such dependencies. The benefits are that your web application becomes more portable, flexible and lightweight.

Let’s start with the implementation. I modeled my OWIN implementation after the one provided by Microsoft.

public interface IAppBuilder
{
    IDictionary<string, object> Properties { get; }
    object Build(Type returnType);
    IAppBuilder New();
    IAppBuilder Use(object middleware, params object[] args);
}

For the purpose of this post we will implement the Properties property and the Use method. Let’s define our AppFunc application delegate as follows:

delegate Task AppFunc(IDictionary<string, object> environment);

The examples from Katana project provide the following code template for the main function:

static void Main(string[] args)
{
    using (WebApplication.Start<Startup>("http://localhost:5000/"))
    {
        Console.WriteLine("Started");
        Console.ReadKey();
        Console.WriteLine("Stopping");
    }
}

I like it very much so I decided to provide WebApplication class with a single Start method:

public static class WebApplication
{
    public static IDisposable Start(string url)
    {
        return new WebServer(typeof(TStartup));
    }
}

We will provide WebServer implementation later. Let’s see what the implementation of Startup class is:

public class Startup
{
    public void Configuration(IAppBuilder app)
    {
        var myModule = new LightweightModule();
        app.Use(myModule);
    }
}

Let’s summarize it. We have a console application and in the main method it calls Start method and passes two parameters: Startup type and a URL. Start method will start a web server that listens for requests on the specified URL and the server will use Startup class to configure the web application. We don’t have any dependency on System.Web.dll assembly. We have a nice and simple decoupling of the web server and the web application.

So far, so good. Let’s see how the web server configures the web application. In our OWIN implementation we will use reflection to reflect TStartup type and try find Configuration method using naming convention and predefined method signature. The Configuration method instantiates LightweightModule object and passes it to the web server. The web server will inspect the object for its type and will try to find Invoke method compatible with the AppFunc signature. Once Invoke method is found it will be called for every web request. Here is the actual Use method implementation:

public IAppBuilder Use(object middleware, params object[] args)
{
    var type = middleware.GetType();
    var flags = BindingFlags.Instance | BindingFlags.Public;
    var methods = type.GetMethods(flags);

    // TODO: call method "void Initialize(AppFunc next, ...)" with "args"

    var q = from m in methods
            where m.Name == "Invoke"
            let p = m.GetParameters()
            where (p.Length == 1)
                   && (p[0].ParameterType == typeof(IDictionary<string, object>))
                   && (m.ReturnType == typeof(Task))
            select m;

    var candidate = q.FirstOrDefault();

    if (candidate != null)
    {
        var appFunc = Delegate.CreateDelegate(typeof(AppFunc), middleware, candidate) as AppFunc;
        this.registeredMiddlewareObjects.Add(appFunc);
    }

    return this;
}

Finally we come to WebServer implementation. This is where Nginx comes. For the purpose of this post we will assume that Nginx server is started and configured. You can easily extend this code to start Nginx via System.Diagnostics.Process class. I built and tested this example with Nginx version 1.4.2. Let’s see how we have to configure Nginx server. Open nginx.conf file and find the following settings:

    server {
        listen       80;
        server_name  localhost;

and change the port to 5000 (this is the port we use in the example). A few lines below you should see the following settings:

        location / {
            root   html;
            index  index.html index.htm;
        }

You should modify it as follows:

        location / {
            root   html;
            index  index.html index.htm;
            fastcgi_index Default.aspx;
            fastcgi_pass 127.0.0.1:9000;
            include fastcgi_params;
        }

That’s all. In short, we configured Nginx to listen on port 5000 and configured fastcgi settings. With these settings Nginx will pass every request to a FastCGI server at 127.0.0.1:9000 using FastCGI protocol. FastCGI is a protocol for interfacing programs with a web server.

So, now we need a FastCGI server. Implementing FastCGI server is not hard but for the sake of this post we will use SharpCGI implementation. We are going to use SharpCGI library in WebServer implementation. First, we have to start listening on port 9000:

private void Start()
{
    var config = new Options();
    config.Bind = BindMode.CreateSocket;
    var addr = IPAddress.Parse("127.0.0.1");
    config.EndPoint = new IPEndPoint(addr, 9000);
    config.OnError = Console.WriteLine;
    Server.Start(this.HandleRequest, config);
}

The code is straightforward and the only piece we haven’t look at is HandleRequest method. This is where web requests are processed:

private void HandleRequest(Request req, Response res)
{
    var outputBuff = new byte[1000];

    // TODO: use middleware chaining instead a loop

    foreach (var appFunc in this.appBuilder.RegisteredMiddlewareObjects)
    {
        using (var ms = new MemoryStream(outputBuff))
        {
            this.appBuilder.Properties["owin.RequestPath"] = req.ScriptName.Value;
            this.appBuilder.Properties["owin.RequestQueryString"] = req.QueryString.Value;

            this.appBuilder.Properties["owin.ResponseBody"] = ms;
            this.appBuilder.Properties["owin.ResponseStatusCode"] = 0;

            var task = appFunc(this.appBuilder.Properties);

            // TODO: don't task.Wait() and use res.AsyncPut(outputBuff);

            task.Wait();
            res.Put(outputBuff);
        }
    }
}

This was the last piece from our OWIN implementaion. This is where we call the web application specific method via AppFunc delegate.

In closing I think OWIN helps the developers to build better web applications. Please note that my implementation is neither complete neither production-ready. There is a lot of room for improvement. You can find the source code here:

OWINDemo.zip


Software Razzie Awards

This is not a new idea. Every now and then someone suggests it. Apparently I hear about it more often than, say, 5 years ago. Sure, today software is more spread than 5 years ago but somehow I don’t think this is the only reason.

I guess the main reason for people dissatisfaction is that nowadays people have higher expectation of the product’s quality. Let’s take for example the mobile apps. Everyone expects mobile apps to work fast and smooth and to provide good user experience. These expectations are transferred to the PCs as well. What was acceptable 5 years ago is not anymore.

Also I don’t think software became worse with time. Sure, there are products affected from software bloat. Some notorious examples are Nero Burning ROM and iTunes. Although software bloat manifests in APIs (e.g. Win32 API and Linux Kernel API) and frameworks (e.g. JDK and .NET) there is a tendency that most developers try to minimize and control their code. As a result a new wave of lightweight software (e.g. Google Chrome, Node.js, nginx, etc.) becomes popular.

So, what if there are Software Razzie Awards? There are Pwnie Awards but they are very security focused. I still cannot decide if such awards can be stimulating for the IT industry or not. I guess it won’t harm anyone.

Software agents from the past

Nowadays, we are all familiar with Siri, Google Now and TellMe but are these intelligent personal assistants something new? Probably you remember Clippy or Rover that Microsoft introduced in the late 1990s and early 2000s. Or probably you remember the intelligent personal assistants for Mac OS or OS/2.

Today, I would like to remind you about the agents built by SRI International back in 1990s. Check these short videos out.

You can find the original videos at http://www.ai.sri.com/~oaa/distrib.html#videos.

Dispose Pattern

There are a lot of blog posts and articles about the proper IDisposable implementation, so why writing another one? I guess I am writing it because the topic is quite subjective as there are many different scenarios for IDisposable usage.

I am not going to explore all the details about IDisposable implementation. I would recommend the following readings though I would advise you to be a selective reader so don’t take everything for granted truth:

These are valuable articles because they contain a lot of different opinions. I would also recommend the following two MSDN links which you may find contradicting:

While the most people talk about Dispose and Finalize patterns as different things I would recommend to be careful and to think about them as a single pattern. It is always hard, even impossible, to predict how your code will be used from other software developers. So, having a safe strategy and implementing Dispose and Finalize patterns together might be the right choice.

Let’s see the following class definition:

public class ProcessInfo : IDisposable
{
    [DllImport("kernel32")]
    static extern IntPtr OpenProcess(int dwDesiredAccess, bool bInheritHandle, int dwProcessId);

    [DllImport("kernel32")]
    static extern int GetCurrentProcessId();

    [DllImport("kernel32")]
    static extern bool CloseHandle(IntPtr hHandle);

    private readonly IntPtr hProcess;

    public ProcessInfo()
    {
        const int PROCESS_VM_READ = 0x10;

        this.hProcess = OpenProcess(PROCESS_VM_READ, false, GetCurrentProcessId());
    }

    public void Dispose()
    {
        this.Dispose(true);
        GC.SuppressFinalize(this);
    }

    protected virtual void Dispose(bool disposing)
    {
        if (this.hProcess != IntPtr.Zero)
        {
            CloseHandle(hProcess);
        }
    }
}

It is not the best example but let’s pretend this class has some useful methods and properties for the current process. Because the class implements IDisposable interface it is reasonable to expect something like the following code:

using (var procInfo = new ProcessInfo())
{
    // call some methods and properties
}

The code fragment above seems all good and fine. The tricky part is that the C# compiler will actually emit the following equivalent code:

ProcessInfo procInfo = null;
try
{
    procInfo = new ProcessInfo();
    // call some methods and properties
}
finally
{
    if (procInfo != null)
    {
        procInfo.Dispose();
    }
}

Let’s focus on the constructor. The main purpose of the constructor is to construct an object. This means that the constructed object should be in a usable state. This concept is deeply embraced in .NET base class library. Let’s see the following code fragment:

var fs = new FileStream("", FileMode.Open);

As you can guess, it will throw ArgumentException. Let’s see another canonical example:

public class Person
{
    public Person(string name, uint age)
    {
        if (string.IsNullOrWhiteSpace(name))
        {
            throw new ArgumentException("invalid name", "name");
        }

        if (age < MIN_AGE)
        {
            throw new ArgumentException("invalid age", "age");
        }

        // store "name" and "age"
    }
    // Some useful methods and properties
}

Most of us have written such code. Often it is perfectly legal to throw an exception when we cannot construct a usable object. Back to our example:

using (var procInfo = new ProcessInfo())
{
    // call some methods and properties
}

If an exception is thrown in the constructor then procInfo variable won’t be assigned and therefore Dispose() method won’t be called. Let’s modify ProcInfo constructor a bit:

public ProcessInfo()
{
    const int PROCESS_VM_READ = 0x10;

    this.hProcess = OpenProcess(PROCESS_VM_READ, false, GetCurrentProcessId());

    // something wrong
    throw new Exception();
}

Oops, we have Win32 handle leak. One option is to use try-catch clause inside the constructor and call CloseHandle(…) method. Sometimes this is the best option.

Another option is to implement the Finalize pattern. It is easy and I find it more clear:

~ProcessInfo()
{
    this.Dispose(false);
}

Now, there are clear roles for the constructor and Dispose/Finalize methods and the Win32 handle leak is fixed.

Introduction to CLR metadata

If you are a .NET developer then you’ve probably heard or read about CLR metadata. In this blog post I will try to give you a pragmatic view of what CLR metadata is and how to work with it. You are going to learn how to use unmanaged metadata API from C# code. I will try to keep the blog post brief and clear, so I am going to skip some details where is possible. For more information, please refer to the links at the end.

A Simple Case Example

To make things real we will try to solve the following problem. Suppose we have the following interface definition in C#:

interface IFoo
{
    string Bar { get; }
    string Baz { set; }
}

Our goal is to get the property names (think of System.Reflection.PropertyInfo) with a pretty and fluent syntax in C#. For property Bar the task is trivial:

IFoo foo = null;
Expression<Func<string>> expr = () => foo.Bar;
var pi = (expr.Body as MemberExpression).Member as PropertyInfo;

In the case when the property has a getter we can leverage the power of C# compiler and use C# expression trees. The things for property Baz are more complicated. Usually, we end up something like this:

IFoo foo = null;
Action act = () => foo.Baz = "";

In this case the compiler emits a new type and the things get ugly because we have to decompile IL code in order to get the property name. As we are going to see, we will use the metadata API for a very simple form of decompilation.

Background

The term metadata refers to “data about data”.
wikipedia

When it comes to CLR metadata the term metadata refers to what is known as descriptive metadata. I promised that I will be pragmatic, so let’s see a real example. I guess that you, as a .NET developer, know that Microsoft promotes .NET as a platform that solve the problem known as DLL hell. The main argument is that .NET provides a feature called Strong-Name Signing that assigns a unique identity to an assembly. Suppose we have two assemblies LibraryA.DLL and LibraryB.DLL and the former depends on the latter.

libalibb

Suppose that during deployment we accidentally deploy LibraryB.DLL version 1.0.0.0 instead of version 2.5.0.0. The next time CLR tries to load the assembly LibraryA.DLL it will detect that we have deployed a wrong version of LibraryB.DLL and will fail with assembly load exception. Let’s see another scenario. You find and fix a bug in assembly LibraryB.DLL and replace the older file with the new one. Your existing assembly LibraryA.DLL continues to work as expected.

From these two scenarios, it is easy to guess that assembly LibraryA.DLL has enough information about LibraryB.DLL so that the CLR can spot the difference in case of improper deployment. This information comes from the CLR metadata. Assembly LibraryB.DLL has metadata that stores information about it (assembly name, assembly version, public types, etc.). When the compiler generates assembly LibraryA.DLL it stores in its metadata information about assembly LibraryB.DLL.

The CLR metadata is organized as a normalized relational database. This means that CLR metadata consists of rectangular tables with foreign keys between each other. In case you have previous experience with databases you should be familiar with this concept. Since .NET 2.0 there are more than 40 tables that define the CLR metadata. Here is a sample list of some of the tables:

  • Module (0x00) – contains information about the current module
  • TypeRef (0x01) – contains information about the types that are referenced from other modules
  • TypeDef (0x02) – contains information about the types defined in the current module
  • Field (0x04) – contains information about the fields defined in the current module
  • Method (0x06) – contains information about the methods defined in the current module
  • Property (0x17) – contains information about the properties defined in the current module
  • Assembly (0x20) – contains information about the current assembly
  • AssemblyRef (0x23) – contains information about the referenced assemblies

We can see that most of the information is organized around the current module. As we will see it soon, this organizational model is reflected in the metadata API. For now, it is important to say that an assembly has one or more modules. The same model is used in System.Reflection API as well. You can read more about it here.

Internally, the CLR metadata is organized in a very optimized format. Instead of using human readable table names it uses numbers (table identifiers, TIDs). In the table list above the numbers are shown in hexadecimal format. To understand the CLR metadata, we have to know another important concept – Record Index (RID). Let’s have a look at TypeDef table. Each row (record) in TypeDef table describes a type that is defined in the current module. The record indexes are continuously growing starting from 1. The tuple (TID, RID) is enough to unambiguously identify every metadata record in the current module. This tuple is called metadata token. In the current CLR implementation metadata tokens are 4 byte integers where the highest byte is TID and the rest 3 bytes are used for RID. For example, the metadata token 0x02000006 identifies the 6th record from TypeDef table.

Let’s see the content of metadata tables. The easiest way is to use ILDASM tool. For the sake of this article I will load System.DLL assembly.

ildasm0

Once the assembly is loaded you can see the CLR metadata via View->MetaInfo->Show menu item (you can use CTRL+M shortcut as well). It takes some time to load all the metadata. Let’s first navigate to AssemblyRef (0x23) table.

ildasm2

As we can see the assembly System.DLL refers to 3 other assemblies (mscorlib, System.Configuration and System.Xml). For each row (record), we can see what the actual column (Name, Version, Major, Minor, etc.) values are. Let’s have a look at TypeRef (0x01) table. The first record describes a reference to System.Object type from assembly with token 0x23000001, which is mscorlib (see the screenshot above). The next referred type is System.Runtime.Serialization.ISerializable and so on.

ildasm3ildasm4
By now, I hope you understand at high level what CLR metadata is and how it is organized. There are a lot of tricky technical details about the actual implementation, but they are not important for the sake of this article. I encourage you to play with ILDASM and try the different views under View->MetaInfo menu. For more information, please refer to the links at the end.

Let’s write some code

Microsoft provides unmanaged (COM based) API to work with metadata. This API is used by debuggers, profilers, compilers, decompilers and other tools. First, we have to obtain an instance of CorMetaDataDispenser which implements IMetaDataDispenserEx interface. Probably, the easiest way is to use the following type definition:

[ComImport, GuidAttribute("E5CB7A31-7512-11D2-89CE-0080C792E5D8")]
class CorMetaDataDispenserExClass
{
}
//
var dispenser = new CorMetaDataDispenserExClass();

The value “E5CB7A31-7512-11D2-89CE-0080C792E5D8” passed to the GuidAttribute constructor is the string representation of the CLSID_CorMetaDataDispenser value defined in cor.h file from the Windows SDK. Another way to obtain an instance of the metadata dispenser is through Type/Activator collaboration:

Guid clsid = new Guid("E5CB7A31-7512-11D2-89CE-0080C792E5D8");
Type dispenserType = Type.GetTypeFromCLSID(clsid);
object dispenser = Activator.CreateInstance(dispenserType);

Either way, we cannot do much with the dispenser instance right now. As we said earlier, we need an instance of IMetaDataDispenserEx interface, so let’s cast it to IMetaDataDispenserEx interface:

var dispenserEx = dispenser as IMetaDataDispenserEx;

The CLR will do QueryInterface for us and return the right interface type. Let’s see IMetaDataDispenserEx definition:

[ComImport, GuidAttribute("31BCFCE2-DAFB-11D2-9F81-00C04F79A0A3"), InterfaceType(ComInterfaceType.InterfaceIsIUnknown)]
interface IMetaDataDispenserEx
{
    uint DefineScope(ref Guid rclsid, uint dwCreateFlags, ref Guid riid, out object ppIUnk);

    uint OpenScope(string szScope, uint dwOpenFlags, ref Guid riid, out object ppIUnk);

    uint OpenScopeOnMemory(IntPtr pData, uint cbData, uint dwOpenFlags, ref Guid riid, out object ppIUnk);

    uint SetOption(ref Guid optionid, object value);

    uint GetOption(ref Guid optionid, out object pvalue);

    uint OpenScopeOnITypeInfo(ITypeInfo pITI, uint dwOpenFlags, ref Guid riid, out object ppIUnk);

    uint GetCORSystemDirectory(char[] szBuffer, uint cchBuffer, out uint pchBuffer);

    uint FindAssembly(string szAppBase, string szPrivateBin, string szGlobalBin, string szAssemblyName, char[] szName, uint cchName, out uint pcName);

    uint FindAssemblyModule(string szAppBase, string szPrivateBin,string szGlobalBin, string szAssemblyName, string szModuleName, char[] szName, uint cchName, out uint pcName);
}

For the sake of readability, I removed all the marshaling hints that the CLR needs when doing the COM interop. Let’s see some of the details in this interface definition. The value “31BCFCE2-DAFB-11D2-9F81-00C04F79A0A3” is the string representation of IID_IMetaDataDispenserEx value defined in cor.h file from the Windows SDK. For the purpose of this article we are going to call the following method only:

uint OpenScope(string szScope, uint dwOpenFlags, ref Guid riid, out object ppIUnk);

Here goes the method description from the MSDN documentation:

  • szScope – The name of the file to be opened. The file must contain common language runtime (CLR) metadata
  • dwOpenFlags – A value of the CorOpenFlags enumeration to specify the mode (read, write, and so on) for opening
  • riid – The IID of the desired metadata interface to be returned; the caller will use the interface to import (read) or emit (write) metadata. The value of riid must specify one of the “import” or “emit” interfaces. Valid values are IID_IMetaDataEmit, IID_IMetaDataImport, IID_IMetaDataAssemblyEmit, IID_IMetaDataAssemblyImport, IID_IMetaDataEmit2, or IID_IMetaDataImport2
  • ppIUnk – The pointer to the returned interface

The most interesting parameter is the third one (riid). We have to pass the GUID of the interface we want to get. In our case this is IMetaDataImport  interface (import interfaces are used to read metadata while emit interfaces are used to write metadata).

So, to obtain an instance of IMetaDataImport  interface we have to find its GUID from cor.h file and call OpenScope method:

Guid metaDataImportGuid = new Guid("7DAC8207-D3AE-4c75-9B67-92801A497D44");
object rawScope = null;
var hr = dispenserEx.OpenScope("myAssembly.dll", 0, ref metaDataImportGuid, out rawScope);
var import = rawScope as IMetaDataImport;

Finally, we have an instance of IMetaDataImport interface. Because the interface has more than 60 methods I present here only the methods we are going to use:

[ComImport, GuidAttribute("7DAC8207-D3AE-4C75-9B67-92801A497D44"), InterfaceType(ComInterfaceType.InterfaceIsIUnknown)]
interface IMetaDataImport
{
    void CloseEnum(IntPtr hEnum);

    uint GetScopeProps(char[] szName, uint cchName, out uint pchName, ref Guid pmvid);

    uint GetTypeRefProps(uint tr, out uint ptkResolutionScope, char[] szName, uint cchName, out uint pchName);

    uint ResolveTypeRef(uint tr, ref Guid riid, out object ppIScope, out uint ptd);

    uint EnumMethods(ref IntPtr phEnum, uint cl, uint[] rMethods, uint cMax, out uint pcTokens);

    uint GetMethodProps(uint mb, out uint pClass, char[] szMethod, uint cchMethod, out uint pchMethod, out uint pdwAttr, out IntPtr ppvSigBlob, out uint pcbSigBlob, out uint pulCodeRVA, out uint pdwImplFlags);

    uint GetMemberRefProps(uint mr, out uint ptk, char[] szMember, uint cchMember, out uint pchMember, out IntPtr ppvSigBlob, out uint pbSigBlob);

    // for brevity, the rest of the methods are omitted
}

Probably the most interesting methods are GetMethodProps and GetMemberRefProps. The first method takes MethodDef token as a first parameter while the second method takes MemberRef token. As we know, MethodDef tokens are stored in Method (0x02) table and MemberRef tokens are stored in MemberRef (0x0a) table. The first ones describe methods defined in the current module while the second ones describe methods (and members) referenced from other modules.

At first sight there is not much difference between MethodDef and MemberRef tokens, but as we are going to see the difference is crucial. Let’s have a look at the following code fragment:

Expression<Func<bool>> expr = () => string.IsNullOrEmpty("");
MethodInfo mi = (expr.Body as MethodCallExpression).Method;
int methodDef = mi.MetadataToken;

The sole purpose of this code is to obtain the MethodDef token of IsNullOrEmpty method. At first it may not be obvious but MetadataToken property returns the MethodDef token of that method. On my machine the actual token value is 0x06000303. So, the table name is MethodDef (0x06) and the RID is 0x303. A quick check with ILDASM tool confirms it:

ildasm5

Let’s experiment and execute the following code fragment:

Type[] mscorlibTypes = typeof(string).Assembly.GetTypes();
var q = from type in mscorlibTypes
        from method in type.GetMethods()
        where method.MetadataToken == 0x06000303
        select method;

MethodInfo mi2 = q.SingleOrDefault();
// "same" is true
bool same = object.ReferenceEquals(mi, mi2);

So, our strategy is to get the MethodDef token of the property setter and then run a LINQ query similar to the one shown above. In reality the code is more complex:

private static MethodInfo GetMethodInfoFromScope(uint token, Assembly assemblyScope, Guid mvid)
{
    MethodInfo mi = null;

    if ((token != mdTokenNil) && (assemblyScope != null) && (mvid != Guid.Empty))
    {
        const BindingFlags flags = BindingFlags.Static | BindingFlags.Instance | BindingFlags.Public | BindingFlags.NonPublic;

        var q = from module in assemblyScope.Modules
                from type in module.GetTypes()
                from method in type.GetMethods(flags)
                where (method.MetadataToken == token)
                       && (method.Module.ModuleVersionId == mvid)
                select method;

        mi = q.SingleOrDefault();
    }

    return mi;
}

Because tokens are unique inside a module only, we have to iterate over all assembly modules and find the right one. Fortunately, each module has version id (module version ID, MVID) which is a unique GUID generated during compilation. For example, the module CommonLanguageRuntimeLibrary from mscorlib assembly installed on my machine has the following MVID “AD977517-F6DA-4BDA-BEEA-FFC184D5CD3F”.

ildasm6

We can obtain MVID via GetScopeProps method from IMetaDataImport interface.

So far we saw how to get a MethodInfo object for any method (including property setters) if we know the MethodDef token and the MVID of the containing module. However, we still don’t know how to proceed in case of MemberRef token. The solution is to find the original MethodDef token.

Here is the high level algorithm we have to follow:

  1. Call GetMemberRefProps to get the method name and the TypeRef token of the containing type (this is the second method parameter ptk)
  2. If TypeRef is a nested type, call GetTypeRefProps as many times as needed to get the most outer TypeRef
  3. Call ResolveTypeRef to get IMetaDataImport interface for the module that contains the corresponding TypeDef token
  4. Call EnumMethods for the TypeDef token from previous step
  5. For each MethodDef from previous step, call GetMethodProps to get its name, compare it with the name from step 1 and if they match return the current MethodDef token

This algorithm can be used for any method MemberRef, not just property setters. The only potential pitfall is the string comparison in the last step. As you know, the CLR supports method overloading. Fortunately, the current .NET compilers with property support don’t allow property overloading. Even if that was the case, we can use some of the flags returned by GetMemberRefProps for unambiguous method resolution.

Here is a high level skeleton of the algorithm:

uint methodRef = 0;
IMetaDataImport import = null;

uint typeRef;
uint memberRefNameLen = 0;
uint memberRefSigLen;
var memberRefName = new char[1024];
IntPtr ptrMemberRefSig;
var hr = import.GetMemberRefProps(methodRef, out typeRef, memberRefName, (uint)memberRefName.Length, out memberRefNameLen, out ptrMemberRefSig, out memberRefSigLen);

var name = new string(memberRefName, 0, (int)memberRefNameLen - 1);

uint resScope;
uint parentNameLen;
hr = import.GetTypeRefProps(typeRef, out resScope, null, 0, out parentNameLen);

uint typeDef = mdTokenNil;
object newRawScope = null;
Guid metaDataImportGuid = new Guid(IID_IMetaDataImport);
hr = import.ResolveTypeRef(typeRef, ref metaDataImportGuid, out newRawScope, out typeDef);

var newImport = newRawScope as IMetaDataImport;

var hEnum = IntPtr.Zero;
var methodTokens = new uint[1024];
var methodName = new char[1024];
uint len;
hr = newImport.EnumMethods(ref hEnum, typeDef, methodTokens, (uint)methodTokens.Length, out len);

for (var i = 0; i < len; i++)
{
    uint tmpTypeDef;
    uint attrs;
    var sig = IntPtr.Zero;
    uint sigLen;
    uint rva;
    uint flags;
    uint methodNameLen;
    hr = newImport.GetMethodProps(methodTokens[i], out tmpTypeDef, methodName, (uint)methodName.Length, out methodNameLen, out attrs, out sig, out sigLen, out rva, out flags);

    var curName = new string(methodName, 0, (int)methodNameLen - 1);

    if (name == curName)
    {
        // found methodDef
        break;
    }
}

The actual implementation is more complex. There are two tricky details:

  1. TypeRef resolution from step 2, in case TypeRef token is a token of a nested type
  2. The assemblyScope parameter in GetMethodInfoFromScope method

To solve the first issue we can simply use a stack data structure. We push all TypeRef tokens from GetTypeRefProps method. Then we pop the tokens and resolve them with ResolveTypeRef method. The second issue may not be obvious. We have to pass an assembly instance to GetMethodInfoFromScope method. However the metadata API does not require the CLR loader to load the assembly (in an AppDomain). In a matter of fact the metadata API does not require CLR to be loaded at all. So we have to take care and load the assembly if needed:

newAssembly = AppDomain.CurrentDomain.GetAssemblies().FirstOrDefault(a => a.GetName().FullName.Equals(asmName.FullName));
if (newAssembly == null)
{
    newAssembly = Assembly.Load(asmName);
}
// pass newAssembly to GetMethodInfoFromScope(...) method

So far, we worked mostly with modules but right now we have to find an assembly by name. This means that we have to obtain the assembly name from the current module. For this purpose we are going to use IMetaDataAssemblyImport interface. This interface has more than a dozen methods, but for the sake of this article we are going to use two methods only:

[ComImport, GuidAttribute("EE62470B-E94B-424E-9B7C-2F00C9249F93"), InterfaceType(ComInterfaceType.InterfaceIsIUnknown)]
interface IMetaDataAssemblyImport
{
    uint GetAssemblyFromScope(out uint ptkAssembly);

    uint GetAssemblyProps(uint mda,
                            out IntPtr ppbPublicKey,
                            out uint pcbPublicKey,
                            out uint pulHashAlgId,
                            char[] szName,
                            uint cchName,
                            out uint pchName,
                            out ASSEMBLYMETADATA pMetaData,
                            out uint pdwAssemblyFlags);

    // for brevity, the rest of the methods are omitted
}

To obtain an instance of IMetaDataAssemblyImport interface we have to cast it from existing an instance of IMetaDataImport interface:

var asmImport = import as IMetaDataAssemblyImport;

Again, the CLR will do QueryInterface for us and return the proper interface. Once we have an instance of IMetaDataAssemblyImport interface we use it as follows:

  1. Call GetAssemblyFromScope to obtain the current assemblyId
  2. Call GetAssemblyProps with the assemblyId from the previous step

Until now, we saw how to use the metadata API from C#. One question left unanswered though. How can we get MethodDef or MemberRef token? At the beginning we started with a simple delegate, so we can use it to get the byte array of IL instructions that represent the method body:

Action act = () => foo.Baz = "";
byte[] il = act.Method.GetMethodBody().GetILAsByteArray();

It is important to recall that our goal is to decompile the method body of the method pointed by this delegate. This method has a few instructions, it simply calls the property setter with some value. We are not going to do any kind of control flow analysis. All we are going to do is to find the last method invocation (in our case the property setter) inside the method body.

Almost every method call in the CLR is done through call or callvirt instruction. Both instructions take a method token as a single parameter. All we have to do is parse the IL byte array for call or callvirt instruction and interpret the next 4 bytes as a method token. We then check whether the token is MethodDef or MemberRef and if this is the case we pass it to the metadata API.

I hope this article gave you an idea what metadata API is and how to use it from C#. I tried to focus on the interfaces needed for solving our specific scenario. The metadata API has much more functionality than what we saw here. It allows you to emit new methods, new types and new assemblies as well.

Source Code

MetadataDemo.zip

References


Analyzing crash dumps with ClrMD

Microsoft recently released the first beta version of Microsoft.Diagnostics.Runtime component. Lee Culver describes ClrMD as follows:

ClrMD is a set of advanced APIs for programmatically inspecting a crash dump of a .NET program much in the same way as the SOS Debugging Extensions (SOS). It allows you to write automated crash analysis for your applications and automate many common debugger tasks.

Lee Culver also showed a nice LINQ query over heap objects. This example reminds me the SharpDevelop approach to Profiler Query Language (PQL). Here is the short description of PQL:

  •  PQL v1.1 (SharpDevelop 4.x)
    •  Extend PQL capabilities (Views and Categories)
    •  PQL code completion and editing improvements
    •  PQL performance improvements (optimized LINQ implementation LINQ-to-Profiler)

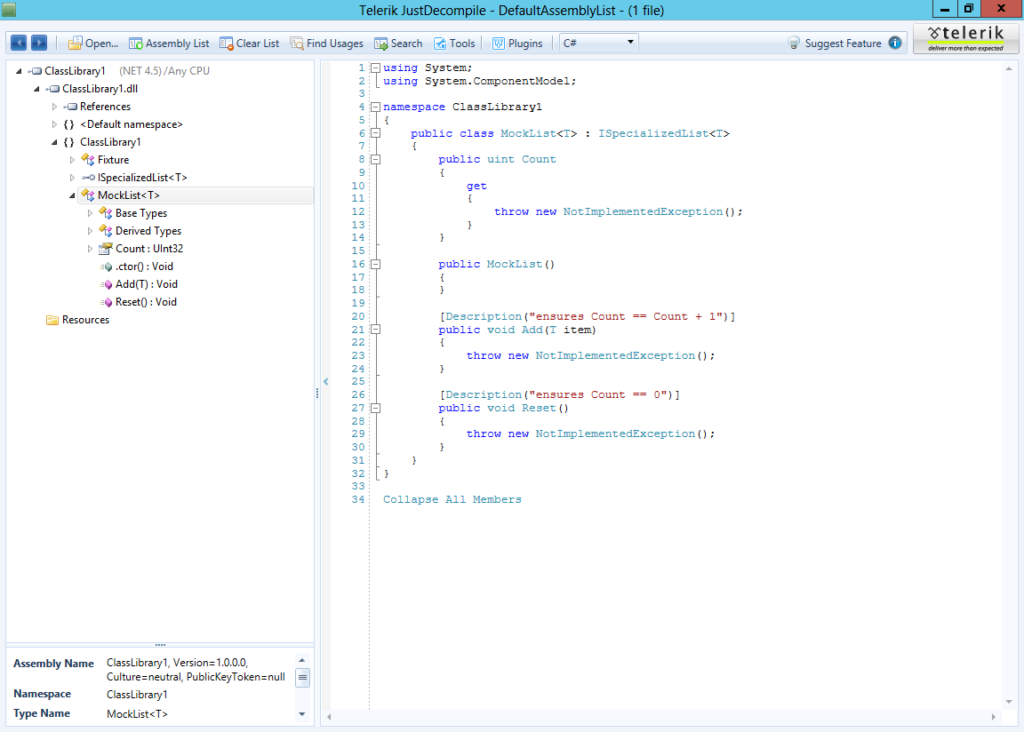
I am very keen on PQL concept and the ClrMD component makes it possible. I decided to have a high-level overview of ClrMD implementation so I loaded the assembly in JustDecompile.

clrmd1

I was not surprised to see that Microsoft reused a lot of code from PerfView which is built around IXCLRDataProcess interface. Actually the latest PerfView version (1.4.1.0) already comes with ClrMD component instead of ClrMemDiag assembly. Something else caught my eye though. This is the Redhawk namespace. And this is a very nice surprise indeed.

For those who are not familiar with Redhawk I would recommend the following Channel 9 page. As far as I know, there is nothing official about Redhawk yet and the ClrMD component might be the first clue. What is coming next? Only time will tell.